Trading forex without a strategy is a bit like starting out on a trip without a map since you never know where your account will end up. You might make money or lose money, but you have no idea which is more likely. The big advantage of having a forex trading strategy is that you can take some of the guesswork out of trading currencies. Read on to find out more about the best forex trading strategies and how to choose among them to trade currencies successfully.
A forex trading strategy defines how you will enter and exit trades, by using technical indicators to identify key price levels. While there are hundreds of strategies, we’ve compiled a list of ten of the most frequently used. Forex traders and market analysts are constantly creating new strategies to find the best time and point at which to enter or exit a trade. These are ten of the most popularly used strategies for trading currency pairs.
Top 10 forex strategies
- Bollinger band forex strategy
- Momentum indicator forex strategy
- Fibonacci forex strategy
- Bladerunner forex strategy
- Moving average crossovers forex strategy
- MACD forex strategy
- Keltner Channel strategy
- Fractals indicator forex strategy
- RSI indicator forex strategy
- Breakout trading forex strategy
Get Started Forex Trading Risk Free with $100,000 in Virtual Cash.
Put your trading skills to the test with our FREE Forex Simulator. Submit trades in a virtual environment before you start risking your own money. Practice trading strategies so that when you're ready to enter the real market, you've had the practice you need.
Try our Forex Simulator Today >>>
1. Bollinger Band Forex Strategy
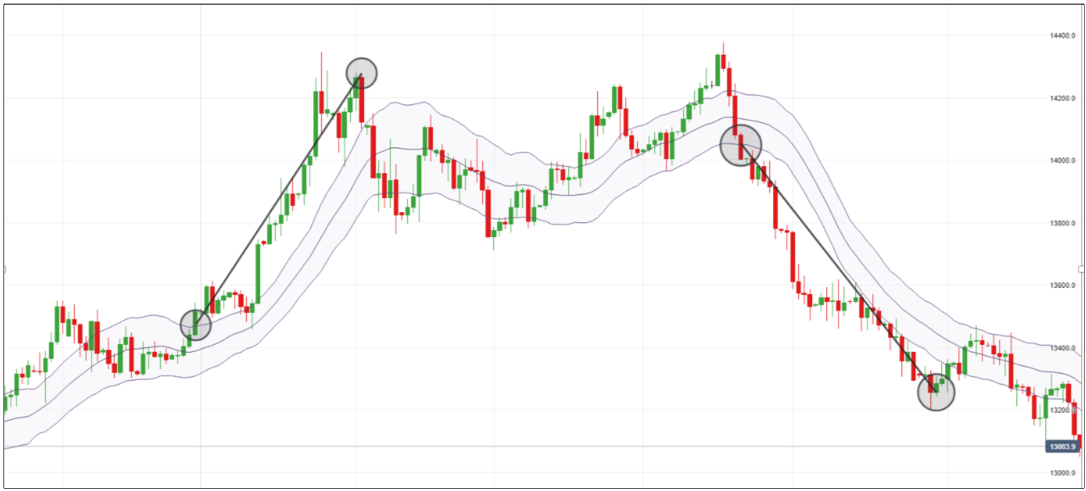
A Bollinger band strategy is used to establish likely support and resistance levels that might lie in the market.
The Bollinger tool consists of three bands: the central line is a simple moving average (SMA) set to a period of 20 days, while the upper and lower lines measure the volatility on the market. If the forex market is highly volatile, the bands will widen, and if the market is more stable, the bands will get closer together. When the price reaches the outer bands of the Bollinger, it often acts as a trigger for the market to rebound back towards the central 20-period moving average.
Forex traders can identify possible points of support and resistance when the price moves outside of the Bollinger band. When this happens, either the market will break out of its range, or the move will be temporary and eventually the price will return to the direction it came from. The bands help forex traders establish entry and exit points for their trades, and act as a guide for placing stops and limits.

2. Momentum Indicator Forex Strategy
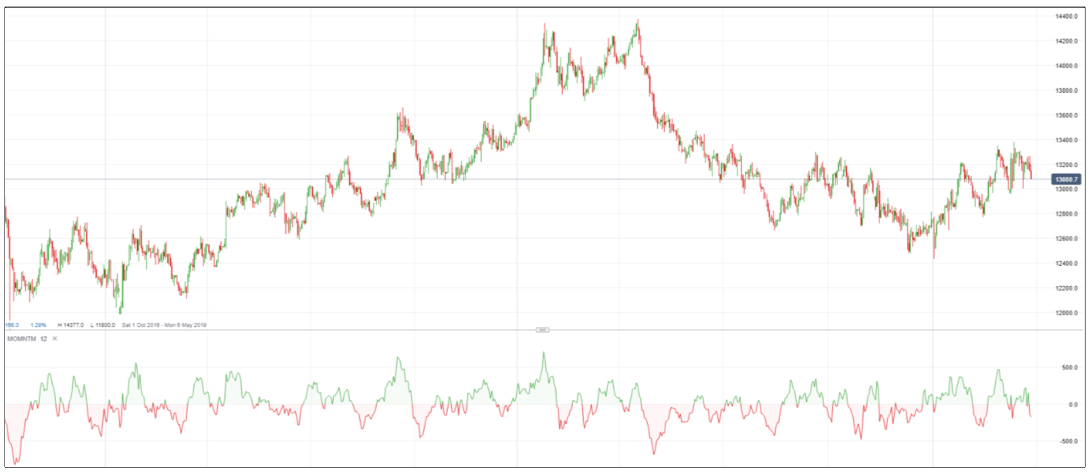
The momentum indicator takes the most recent closing price and compares it to the previous closing price. It is then displayed as a single line, usually on a separate chart below the main price chart.
The indicator oscillates to and from a centreline of 100. How far the indicator line is above or below 100 indicates how quickly the price is moving. For example, a reading of 102 would indicate the market is moving more quickly upward than a reading of 101, while a reading of 98 would indicate the market has a stronger downtrend than a reading of 99.
Momentum indicators can be a useful tool when providing overbought and oversold signals. Forex traders can use it to identify the strength of the market movement, and whether the price is moving up or down.
It is important to ensure that the market has respected the momentum indicator on previous occasions and find the exact conditions that seem to be working.
3. Fibonacci Forex Strategy
Fibonacci retracements are used to identify areas of support and resistance, using horizontal lines to indicate where these key levels might be.
These Fibonacci retracement levels are drawn as six lines on an asset’s price chart. The first three are drawn at the highest point (100%), the lowest point (0%) and the average (50%). The remaining three lines are drawn at 61.8%, 38.2% and 23.6%, which are significant percentages in the Fibonacci sequence.
Forex traders can use the Fibonacci indicator to spot where to place their entry and exit orders. The trick is to place your stop-loss below the previous swing low (uptrend), or above the previous swing high (downtrend).

4. Bladerunner Forex Strategy
The Bladerunner forex strategy compares the current market price to the level the indicator says it should be. By looking at this disparity, traders can identify entry and exit points for each trade. The strategy is named because it acts like a knife edge dividing the price – and in reference to the 1982 science fiction film of the same name.
The Bladerunner strategy is based on pure price action, combining candlesticks, pivot points, and support and resistance levels to locate new opportunities. Before you start to use the Bladerunner strategy, it is important to make sure the market is trending. Typically, traders will combine the Bladerunner strategy with Fibonacci levels, to validate their strategy and give themselves some extra security when trading.
The strategy uses a 20-period exponential moving average (EMA) or the central line of the Bollinger band indicator (described above). If the price is above the EMA, it is taken as a sign that it will decrease soon, and if the price is below the EMA, it is seen as a sign that it will increase in the near future.
A trader would wait for the price action to reach the EMA, at which point the theory suggests it will rebound.
The first candlestick that touches the EMA is called the ‘signal candle’, while the second candle that moves away from the EMA again is the ‘confirmatory candle’. Traders would place their open orders at this price level to take advantage of the rebounding price.

5. Moving Average Crossovers Forex Strategy
A crossover is one of the main moving average strategies, which is based on the meeting point or ‘cross’ of two standard indicators. In a standard moving average, the price crosses above or below the moving average line to signal a potential change in trend. But, the crossover strategy applies two different moving indicators – a fast EMA and a slow EMA – to signal trading opportunities when the two lines cross.
An FX trader would enter into a long position when the fast EMA crosses the slow EMA from below, and enter into a short position when the fast EMA crosses the slow EMA from above.
The placement of stop-losses is also determined by this strategy. The stop-loss for a long position would be placed at the lowest price point of the candlestick before the crossover occurred, while the short position stop-loss would be placed at the highest price point of the candlestick before the crossover.
In our example below, the blue line is the fast EMA, set to a nine-day period, while the red line is the slow EMA – set to a 14-day.

6. MACD Forex Strategy
MACD stands for moving average convergence divergence. The basic aim of a forex strategy that uses the MACD is to identify the end of a trend and discover a new trend.
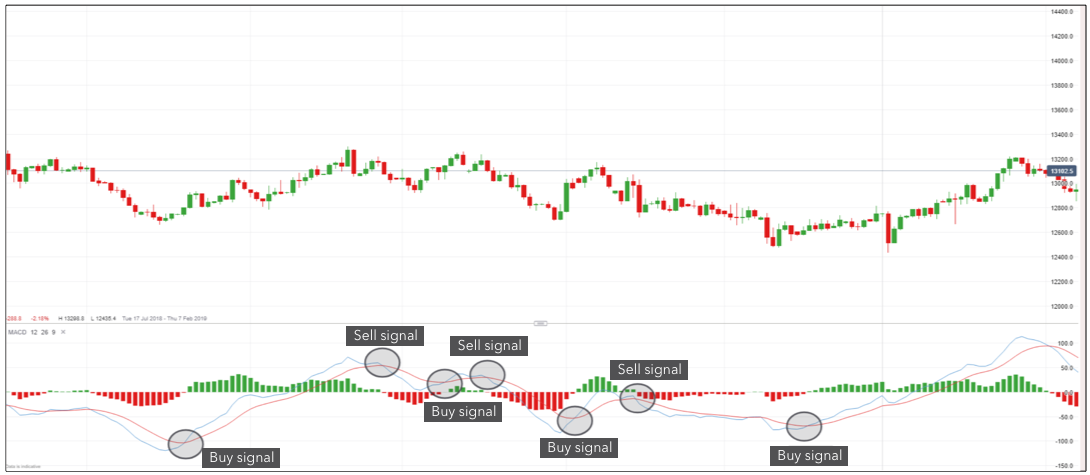
Like the momentum indicator, the MACD appears at the bottom of the main price chart. It consists of three parts: the MACD line, the signal line and the histogram.
The MACD is a momentum indicator that plots the difference between two trend-following indicators or moving averages. As the two moving averages converge and diverge, the lines can be used by forex traders to identify buy and sell signals for currencies – as well as other markets like commodities and shares.
When the MACD line crosses above the signal line, it is a buy signal, and when the signal line crosses above the MACD line it is a sell signal. In the below chart, the MACD line is blue and the signal line is red.
7. Keltner Channel Forex Strategy
The Keltner Channel is a volatility-based trading indicator. Forex traders can use a Keltner Channel strategy to determine when the currency pair has strayed too far from the moving average.
Like the Bollinger band indicator, the Keltner Channel uses two boundary bands – constructed from two ten-day moving averages – either side of an exponential moving average. Traders can use the channels to determine whether a currency is oversold or overbought by comparing the price relationship to each side of the channel.
The theory goes that by plotting the bands a certain distance away from the average of the market price, a trader can ascertain a significant market move. If the market moves through the boundary bands, then in all likelihood the market price will continue to trend in that direction.
8. Fractals Indicator Forex Strategy
Fractals refer to a reoccurring pattern in the midst of larger price movements. The fractal indicator identifies reversal points in the market, found around key points of support and resistance. Forex traders can use a fractal strategy to get an idea about which direction the trend is heading in by trading when a fractal appears at these key levels. Fractals occur extremely frequently, so they are commonly used as part of a wider forex strategy with other indicators.
The fractal pattern itself consists of five candlesticks, and it indicates where a price has struggled to move higher or lower. A fractal must have a central bar that has a higher high or a lower low than the two bars on either side of it.
In an upward fractal, the focus is on the highest bar, and in a downward fractal, the focus is on the lowest bar. A forex strategy based on the fractal indicator would trade if the market moves beyond the high or low of the fractal signal.

9. RSI Indicator Forex Strategy
The relative strength index (RSI) is a popular technical analysis indicator used in a lot of trading strategies. The RSI helps traders to identify market momentum and overbought or oversold conditions.
The RSI indicator is plotted on a separate chart to the asset price chart. It consists of a single line and two levels that are automatically set.
The vertical axis of the RSI goes from 0 to 100 and shows the current price against its previous values. If the price rises to 100, this is an extremely strong upward trend, as typically anything above 70 is thought of as overbought. And if the price falls to 0, it is a very strong continuous downtrend, as anything below the level 30 is considered oversold.
This forex strategy would be based on taking advantage of the market retracements between these price levels. However, it is important to use the indicator as part of a wider strategy to confirm the entry and exit points, as sharp price movements can cause the RSI to give false signals.

10. Breakout Trading Forex Strategy
Breakout trading involves taking a position as early as possible within a given trend. A breakout occurs when the market price ‘breaks out’ from a consolidation or trading range – this is typically when a support or resistance level has been met and surpassed.
Trading breakouts is an important strategy, especially in forex, because the movement represents the start of a volatile period. By waiting for a key level to break, forex traders can enter the market just as the price makes a breakout and ride it until the volatility calms down again.
Commonly, breakouts occur at a historic support or resistance level, but this could change depending on how strong or weak the market is. Your stop-loss should be placed at the point the point the market broke out.
Using a breakout trading strategy relies on being able to see the volume of trades that are taking place on the market. However, there is no way of knowing the volume of trades made in the forex market, as it is decentralised. This makes it imperative to have a good risk management strategy in place.

Get Started Forex Trading Risk Free with $100,000 in Virtual Cash
Put your trading skills to the test with our FREE Forex Simulator. Submit trades in a virtual environment before you start risking your own money. Practice trading strategies so that when you're ready to enter the real market, you've had the practice you need. Try our Forex Simulator Today >>
How it works
Learn about the markets and hone your trading skills at your own pace, with zero risk. Then, when you’re ready, you can easily switch to real trading.
How do I set up my free demo account?
- Log in to the eToro platform or create an account for free
- Access the demo account by selecting Virtual Portfolio from the menu under your username
- Now you can practise trading live markets in real time without risking any capital
- Get Started
Trade and invest in top markets
On eToro, you can invest in global financial markets and easily manage a variety of assets in a single portfolio.
Copy Trading: Trade like eToro’s top traders
CopyTrader, eToro’s most popular feature, allows you to view what real traders are doing in real time and copy their trading automatically. eToro’s award-winning CopyTrader technology is a game changer in the industry, enabling anyone to trade like a top trader!
Whether you’re a beginner learning the basics or you simply don’t have time to watch the markets, now it’s easy to leverage other traders’ expertise. With eToro’s CopyTrader, you can automatically copy top-performing traders, instantly replicating their trading in your own portfolio. Sign up for eToro and start copying other traders at no extra charge. There are no management fees or other hidden costs involved. View our complete pricing policy here.
Start Copy Trading>>>
Go long or short on currencies
Trade on the largest, most active financial market in the world — the foreign currency exchange, also known as FOREX. Buy and sell a wide variety of major USD pairs and other currency crosses, with up to 1:30 leverage (or up to 1:400 as a Professional Client) to gain greater exposure with less capital.
Start Trading Currencies >>>
Buy crypto with ease
Trade a wide variety of leading cryptoassets and crypto crosses, using innovative tools that you won’t find anywhere else. eToro Crypto offers the ultimate crypto solution: trading platform, wallet, and exchange all in one, with the security of a regulated fintech leader that you can trust.
Start Buying Crypto >>>
Invest in stocks with 0% commission
From technology to healthcare, New York to Hong Kong — with fractional shares, it’s easy to fill your portfolio with a variety of leading stocks from the world’s top exchanges. Invest in stocks without paying commission and without limits on trading volume.
Start Investing in Stocks >>>
Discover opportunities with commodities
Take advantage of exciting opportunities in the world’s top resource markets. With one-click trading, flexible leverage, and deep liquidity, trading commodity CFDs allows you to choose an investment amount without being limited to units, such as a whole barrel of oil or an ounce of gold.
Start Trading Commodities >>>
Expand exposure with indices
Benefit from market trends of major stock exchanges around the world — whether they go up or down. Indices are a perfect way to invest in the overall movement of the stock market, with the flexibility to manage your exposure as you see fit.
Start Trading Indices >>>
Diversify with ETFs
Exchange-traded funds (ETFs) allow investors a flexible yet comprehensive way of investing in the financial markets at a low-cost entry point and without management fees — making them ideal for portfolio diversification. eToro offers both investing in ETFs as the underlying asset, as well as trading them as CFDs.
Start Trading ETFs >>>
Add new comment