BMW Stock Price
 Bayerische Motoren Werke AG (XETR: BMW) is more than just a premium car manufacturer; it is a cornerstone of the European industrial economy. Operating through its Automotive, Motorcycles, and Financial Services divisions, BMW manages a robust portfolio of iconic brands, including MINI and Rolls-Royce.
Before adding this automotive giant to your portfolio, explore our comprehensive stock dashboard. Access real-time price quotes, interactive technical analysis charts, and deep fundamental metrics to forecast trends and make data-driven investment decisions.
ISIN: DE0005190003 | FIGI: BBG000BBXB74 | Sector: Consumer Cyclical
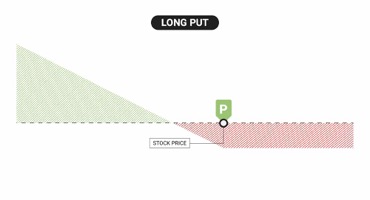
 Tired of setting limit orders that never fill? The Cash-Secured Put (CSP) is a conservative options strategy used by institutional investors to get paid while waiting to buy their favorite stocks at a massive discount.
By selling an out-of-the-money put option and setting aside the cash required for assignment, you eliminate the catastrophic margin risks of naked options. Learn how to generate consistent monthly income, artificially lower your cost basis on top-tier companies, and avoid the devastating "Bagholder Trap."
Tired of setting limit orders that never fill? The Cash-Secured Put (CSP) is a conservative options strategy used by institutional investors to get paid while waiting to buy their favorite stocks at a massive discount.
By selling an out-of-the-money put option and setting aside the cash required for assignment, you eliminate the catastrophic margin risks of naked options. Learn how to generate consistent monthly income, artificially lower your cost basis on top-tier companies, and avoid the devastating "Bagholder Trap."
 In the world of options trading, selling premium without a safety net is known as trading "Naked." While strategies like the Naked Put and Naked Call offer the highest mathematical probability of success, they carry a terrifying caveat: undefined, and potentially infinite, risk. Discover why professional investors like Warren Buffett use uncovered options to acquire stocks at a discount, and why a single mistake in a Naked Call can trigger a devastating margin call. Learn the mechanics of dynamic margin expansion and how to protect your portfolio from tail-risk.
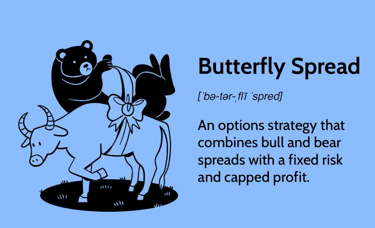 The Butterfly Spread is the "sniper rifle" of options trading. This highly precise, neutral strategy is designed for one specific scenario: when you believe a stock will close at an exact target price on expiration day.
By assembling a 4-leg structure (buying the wings and selling the body), traders can achieve massive risk-to-reward ratios, often risking a minimal amount of capital for significant upside. Discover the math behind the 1-2-1 setup, how to calculate the "tent" breakeven points, and the hidden dangers of expiration day Pin Risk.
The Butterfly Spread is the "sniper rifle" of options trading. This highly precise, neutral strategy is designed for one specific scenario: when you believe a stock will close at an exact target price on expiration day.
By assembling a 4-leg structure (buying the wings and selling the body), traders can achieve massive risk-to-reward ratios, often risking a minimal amount of capital for significant upside. Discover the math behind the 1-2-1 setup, how to calculate the "tent" breakeven points, and the hidden dangers of expiration day Pin Risk.
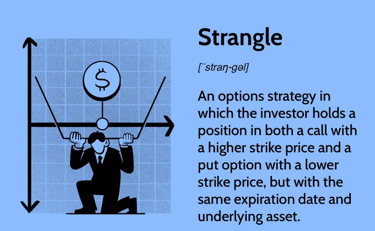 Do you want to profit from explosive market volatility without paying the massive upfront premiums required by a straddle? The Long Strangle is an options strategy designed to give you unlimited profit potential in either direction at a fraction of the cost. By simultaneously buying an Out-of-the-Money (OTM) Call and Put, traders can position themselves for massive breakouts during earnings season or major news events. Learn the mechanics of the "flat bottom" loss zone, how to calculate your widened breakeven points, and the dangers of IV Crush.
 Maximize your gold trading profits with our latest XAUUSD price forecast. Get expert technical analysis, real-time signals, and the most accurate XAU USD prediction today. Whether the market is driven by inflation data, central bank policies, or geopolitical shifts, being prepared is your greatest edge. We break down complex market movements into clear, actionable steps for both day traders and long-term investors. Read the full analysis to refine your strategy and unlock access to premium trading insights!
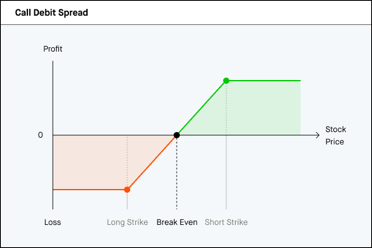 The difference between becoming a consistently profitable options trader and gambling your account away often comes down to understanding Cash Flow. Discover the fundamental mechanics of Credit Spreads (selling premium) versus Debit Spreads (buying premium).
Learn why institutional traders prefer the high-probability nature of net credit strategies, and how to effectively cap your risk using multi-leg setups. This comprehensive guide breaks down the math, the impact of time decay (Theta), and real-world examples to help you optimize your win rate.
The difference between becoming a consistently profitable options trader and gambling your account away often comes down to understanding Cash Flow. Discover the fundamental mechanics of Credit Spreads (selling premium) versus Debit Spreads (buying premium).
Learn why institutional traders prefer the high-probability nature of net credit strategies, and how to effectively cap your risk using multi-leg setups. This comprehensive guide breaks down the math, the impact of time decay (Theta), and real-world examples to help you optimize your win rate.
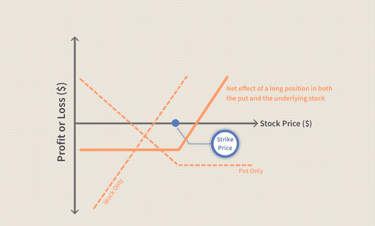 Stop hoping a standard stop-loss order will save your portfolio from a sudden market crash or overnight price gap. The Married Put (or Protective Put) is an options strategy used by institutional investors to buy an ironclad insurance policy for their stock holdings.
By simultaneously holding 100 shares of a stock and purchasing one put option, you guarantee your exit price regardless of how far the market plummets. Learn how to calculate your "deductible," define your absolute maximum risk, and maintain unlimited upside potential with this crucial defensive strategy.
Stop hoping a standard stop-loss order will save your portfolio from a sudden market crash or overnight price gap. The Married Put (or Protective Put) is an options strategy used by institutional investors to buy an ironclad insurance policy for their stock holdings.
By simultaneously holding 100 shares of a stock and purchasing one put option, you guarantee your exit price regardless of how far the market plummets. Learn how to calculate your "deductible," define your absolute maximum risk, and maintain unlimited upside potential with this crucial defensive strategy.
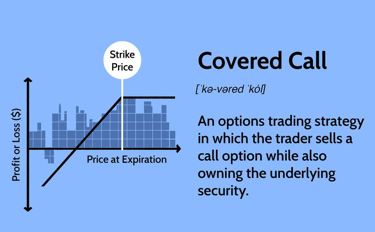 Stop letting your stocks sit idle in your portfolio. The covered call is a conservative options strategy that allows you to "rent out" your shares to generate consistent, upfront cash income, regardless of whether the market goes up, sideways, or slightly down.
By owning 100 shares of an underlying asset and simultaneously selling a call option against them, you collect a premium that immediately lowers your cost basis. Learn the mechanics of this highly popular strategy, how it caps your upside, and why it provides a crucial buffer during market corrections.
Stop letting your stocks sit idle in your portfolio. The covered call is a conservative options strategy that allows you to "rent out" your shares to generate consistent, upfront cash income, regardless of whether the market goes up, sideways, or slightly down.
By owning 100 shares of an underlying asset and simultaneously selling a call option against them, you collect a premium that immediately lowers your cost basis. Learn the mechanics of this highly popular strategy, how it caps your upside, and why it provides a crucial buffer during market corrections.
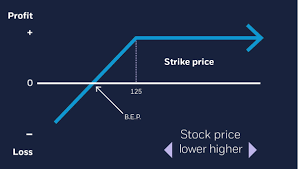
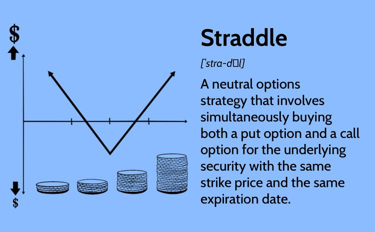 A straddle options strategy lets investors hold both a call and a put with identical strike prices and expiration dates. This neutral strategy aims to profit from significant price changes in the underlying asset, whether it rises or falls. Learn how straddles can indicate expected market volatility and trading ranges.
A trader profits from a long straddle when the security's price moves beyond the strike price by more than the premium cost. The call option has unlimited profit potential if the underlying security's price rises sharply. The profit on the put leg is capped at the difference between the strike price and zero less the premium paid.
A straddle options strategy lets investors hold both a call and a put with identical strike prices and expiration dates. This neutral strategy aims to profit from significant price changes in the underlying asset, whether it rises or falls. Learn how straddles can indicate expected market volatility and trading ranges.
A trader profits from a long straddle when the security's price moves beyond the strike price by more than the premium cost. The call option has unlimited profit potential if the underlying security's price rises sharply. The profit on the put leg is capped at the difference between the strike price and zero less the premium paid.