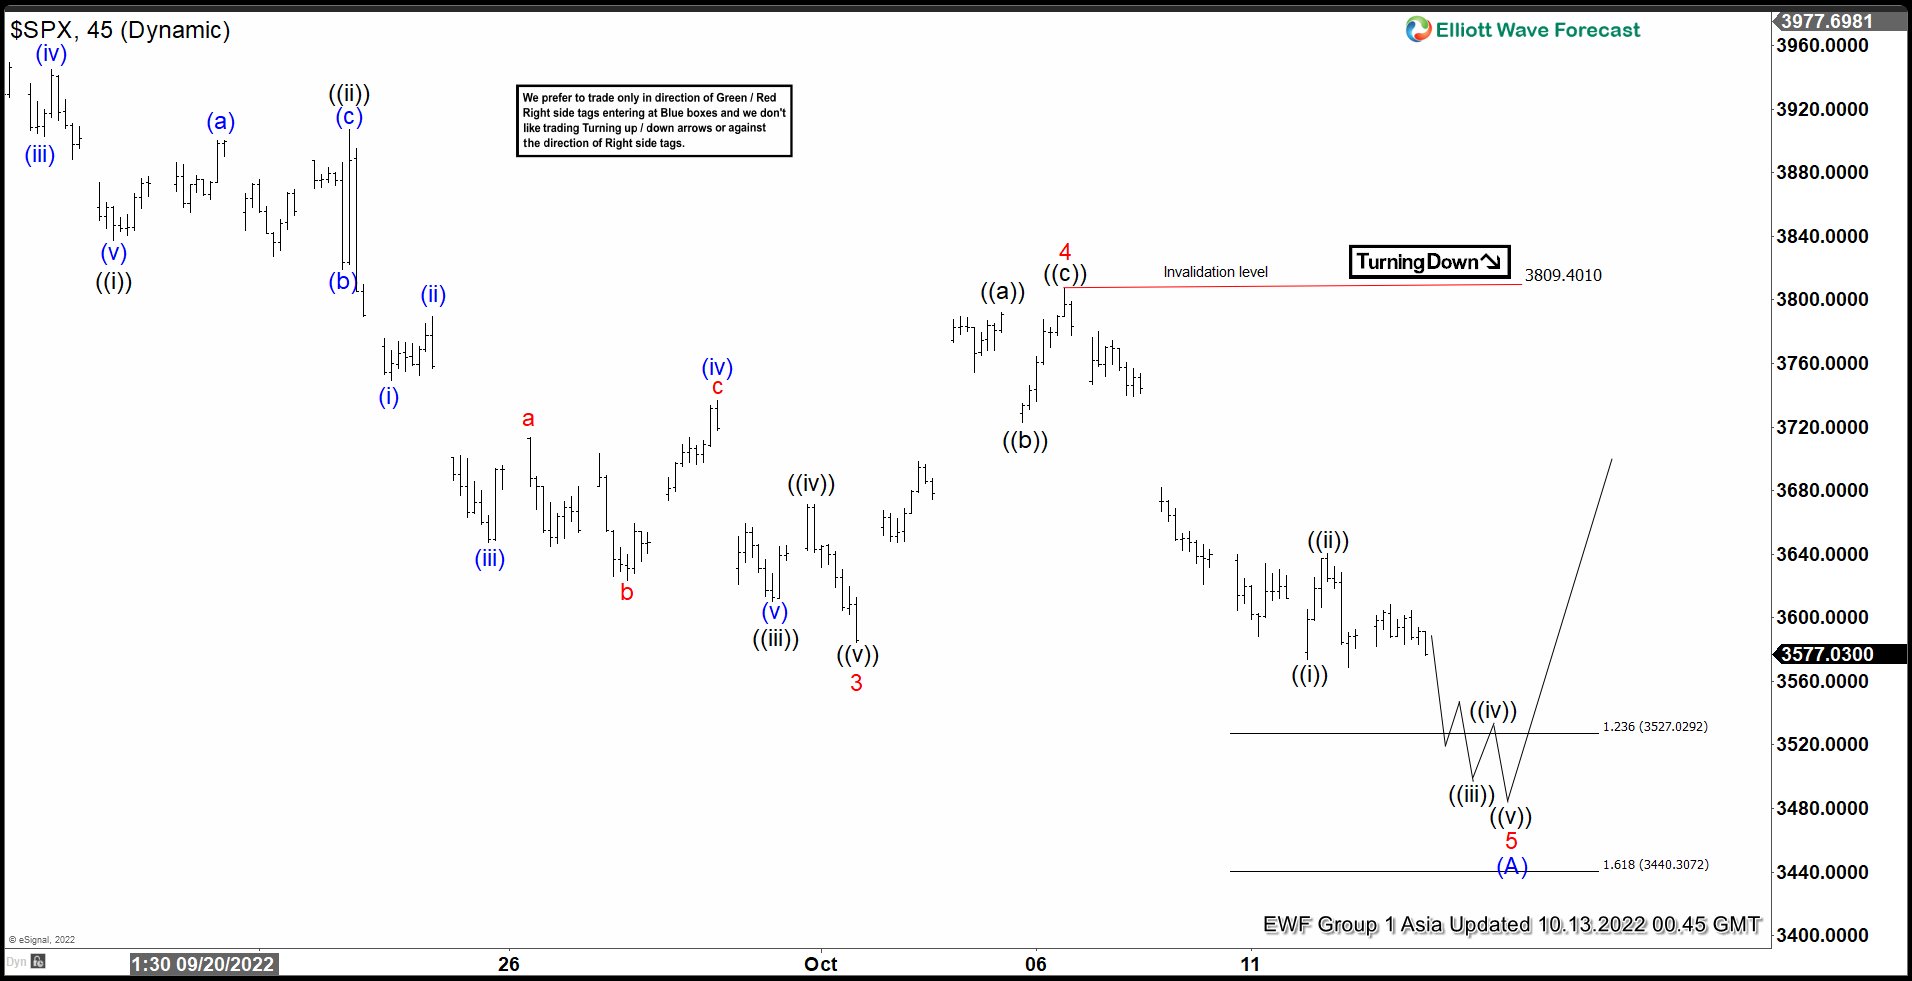
S&P 500 (SPX) shows a 5 swing bearish sequence from 1.4.2022 high calling for further downside towards the extreme area of 2425 – 3150. Short term, the decline from 8.16.2022 high remains in progress as a 5 waves impulse Elliott Wave structure. Down from 8.16.2022 high, wave 1 ended at 3906.03 and rally in wave 2 ended at 4119.28.
The Index resumes lower in wave 3 towards 3584.13. The 45 minutes chart below shows that moves down to end wave 3. Wave 4 ended at 3809.4 as a zigzag structure. Up from wave 3, wave ((a)) ended at 3791.92, wave ((b)) ended at 3722.66, and wave ((c)) ended at 3890.4.
Wave 5 lower is in progress with internal subdivision as another 5 waves in lesser degree. Down from wave 4, wave ((i)) ended at 3573.68 and wave ((ii)) rally ended at 3640.66. While below 3809.4, expect the Index to extend lower to complete wave 5 as an impulse.
Once wave 5 ends, this should also complete wave (A) in higher degree. Index should then end cycle from 8.16.2022 high and see larger corrective rally in wave (B) in 3, 7, or 11 swing to correct that cycle before the decline resumes.
S&P 500 45 Minutes Elliott Wave Chart