
WKN: A3CWWU | ISIN: KYG651631007 | Symbol: JOBY | Type: Stock.
Joby Aviation, Inc. is a transportation company developing an all-electric, vertical take-off and landing aircraft that it intends to operate as a commercial passenger aircraft beginning in 2024. The company was founded by Bevirt Joebenn and is headquartered in Santa Cruz, CA. Joby Stock Price - provides real-time market quotes, online chart, technical and fundamental analysis to help you get more profit from trading.
Simple and lightweight Joby Stock Live Chart is a powerful free tool that allows you to easily conduct technical analysis online without downloading additional files and applications. In order to meet the needs of the most demanding technical analysts, you can find over a hundred chart analysis tools on our Joby stock chart. You can also add any of 80 technical indicators directly to the chart online - in two clicks. The possibilities are endless!
Technical Analysis Joby Stock
Joby Technical Analysis widget is a modern handy tool that shows ratings based on technical indicators data. The design of the widget is made in the form of a speedometer, thanks to which you can quickly see the results of the summary technical analysis. You no longer need to use many indicators for analyzing financial instruments, the widget will do it for you. In addition, all rating data are updated in real time. These technical indicators are used for technical analysis: Relative Strength Index, Stochastic, Commodity Channel Index, Average Directional Index, Awesome Oscillator, Momentum, MACD, Stochastic RSI, Williams Percent Range, Bull Bear Power, Ultimate Oscillator, Exponential Moving Average, Simple Moving Average, Ichimoku Cloud Base Line, Volume Weighted Moving Average, Hull Moving Average.
Fundamental Analysis Joby Stock
The widget displays fundamental data that will help you better understand the current state of the company than simple stock prices. Joby stock fundamentals include: Market Capitalization, Enterprise Value, Balance Sheet, Operating Metrics, Price History, Margins, Income Statement, Dividends and many others important data.
Joby Stock Price Prediction
Joby Aviation is a California-headquartered transportation company developing an all-electric VTOL aircraft that it intends to operate as part of a fast, quiet and convenient air taxi service starting in 2024. The plane, which can fly up to 150 miles on a single charge, can carry a pilot and four passengers at speeds up to 200 miles per hour. It aims to help reduce urban congestion and accelerate the transition to sustainable modes of transport. Founded in 2009, Joby has over 800 employees with offices in Santa Cruz, San Carlos and Marina, California, as well as Washington, DC and Munich, Germany.
How to read and forecast Joby stock price movements?
Joby Aviation, Inc. stock traders use a variety of tools to make a prediction on which way the JOBY market is likely to head next. These tools can roughly be divided into indicators and chart patterns. When trying to make a Joby Aviation, Inc. stock forecast, traders also try to identify important support and resistance levels, which can give an indication of when a downtrend is likely to slow down and when an uptrend is likely to stall.Joby Stock Forecast Indicators
Moving averages are among the most popular Joby Aviation, Inc. stock prediction tools. As the name suggests, a moving average provides the average closing price for JOBY stock over a selected time frame, which is divided into a number of periods of the same length. For example, a 12-day simple moving average for JOBY is a sum of JOBY’s closing prices over the last 12 days which is then divided by 12.In addition to the simple moving average (SMA), traders also use another type of moving average called the exponential moving average (EMA). The EMA gives more weight to more recent prices, and therefore reacts more quickly to recent price action.
50-day, 100-day and 200-day moving averages are among the most commonly used indicators in the stock market to identify important resistance and support levels. If the Joby Aviation, Inc. stock price moves above any of these averages, it is generally seen as a bullish sign for Joby Aviation, Inc. stock. Conversely, a drop below an important moving average is usually interpreted as a negative forecast for the JOBY market.
Traders also like to use the RSI and Fibonacci retracement level indicators to try and ascertain the future direction of the Joby Aviation, Inc. stock price.
How to read Joby stock charts and forecast price movements?
When making a Joby Aviation, Inc. stock forecast, most traders use candlestick charts, as they provide more information than a simple line chart. Traders can view candlesticks that represent the price action of Joby Aviation, Inc. stock with different granularity – for example, you could choose a 5-minute candlestick chart for extremely short-term price action or choose a weekly candlestick chart to identify long-terms trends. 1-hour, 4-hour and 1-day candlestick charts are among the most popular.Let’s use a 1-hour candlestick chart as an example of how this type of price chart gives us information about opening and closing prices. The chart is divided into “candles” that give us information about Joby Aviation, Inc.’s stock price action in 1-hour chunks. Each candlestick will display JOBY’s opening price, closing price, as well as the highest and lowest prices that reached within the 1-hour period. This information makes it easier to make an informed price prediction.
It’s also important to pay attention to the color of the candle – a green candle means that the closing price was higher than the opening price, while a red candle tells us the opposite. Some charts will use hollow and filled candlestick bodies instead of colors to represent the same thing.
What affects the price of JOBY stock?
Just like with any other asset, the price action of Joby Aviation, Inc. stock is driven by supply and demand. These dynamics can be influenced by fundamental factors, such as earnings announcements, new product launches, acquisitions and mergers, and other factors. The JOBY stock price can also be influenced by market sentiment, broader economic conditions, interest rates, inflation rates and political developments.Joby Stock Price Prediction 2025
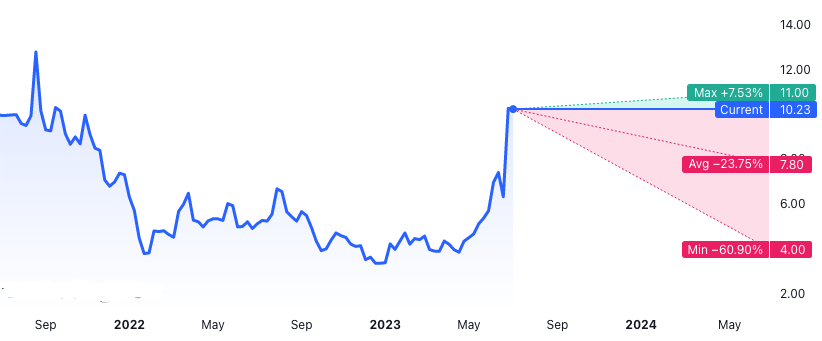
JOBY’s price at the same time last month was $18.39. It has moved by +79.79% in the past month and is currently at $10.23. In fact, in the past 24 hours, JOBY has dumped -0.29%. The long term sentiment, however, remains bullish and JOBY could hit $2.0867 in 2024. In the short term, Joby Aviation Inc Stock go up and down because of the law of supply and demand. Billions of shares of stock are bought and sold each day, and it's this buying and selling that sets stock prices. Demand for Joby Aviation Inc stock drives its price trends, but what causes that demand in the first place?It's all about how investors feel:
- Market sentiment toward JOBY.
- Market sentiment toward the Airports & Air Services industry.
- Market sentiment toward the stock market.
- Confidence in the economy.
When investors develop negative feelings towards the Airports & Air Services industry, all the stocks within it (including JOBY) can be adversely affected, irrespective of the individual performance of each company. In other words, even if Joby Aviation Inc is doing well, it could still experience a decline in its stock price if the industry as a whole is viewed unfavourably by investors.
This works in reverse as well. When investors have a positive outlook on the future of the Airports & Air Services industry, they may eagerly buy shares of a Airports & Air Services company, causing its stock price to surge. This phenomenon can benefit all companies in the industry, as a favourable overall sentiment can lift their stock prices as well. In other words, when one company in a particular sector does well, it can create a positive ripple effect for the entire industry. If investors are confident in the stock market, it can cause an upsurge in demand and prices for Joby Aviation Inc stock (JOBY). This may happen because investors perceive the valuations as attractive, or because the market has been trending upwards. Such a rise in demand can lead to an increase in stock prices across the board.
On the other hand, a declining stock market can dampen investor confidence, leading to more selling and lower stock prices. High valuations can also cause some investors to sell their holdings or reduce their purchases of stocks.
Furthermore, opinions about the trajectory of the economy can impact stock prices. In anticipation of an economic slowdown, investors may sell some of their stocks, while the belief in a recovering or booming economy can create an increase in demand for stocks.
taxonom
Add new comment