Institutions continue to expand their offerings in the cryptocurrency realm as global regulators increasingly seek to establish a working framework to deal with an emerging asset class as adoption surges.
Recently, Fidelity Investments launched a new Ethereum Index fund that will provide its clients with Ether (ETH) exposure, according to a document filed by the company with the SEC on September 26.
The new fund accepts a minimum outside investment of $ 50,000, and has already recorded over $ 5 million in reported sales.
The multi-million dollar asset manager originally launched its cryptocurrency-focused institutional depository and trading platform Fidelity Digital Assets in 2018. The company now offers two exchange-traded crypto funds that are dedicated to digital payments and the metaverse market.
This latest change follows a disclosure last month that Fidelity Investments is considering the idea of allowing all its retail clients to access Bitcoin (BTC) trading directly through its brokerage platform.
Fidelity Digital Assets is also part of a group of institutions that support the launch of EDX Markets (EDXM), "a first-of-its-kind exchange that will meet the hidden demand for digital asset trading by enabling safe and compliant digital asset trading through trusted brokers."
Technical Market Outlook:
The ETH/USD pair keeps heading higher towards the nearest technical resistance located at $1,4017. The momentum is strong and positive on the H4 time frame chart, so ETH bulls are getting ready to follow the recent BTC rally. On the other hand, the next target for bears is seen at the level of $1,100, $1,000 and $990, which means the low from 22th September located at $1,220 should be broken as the down trend will continue. The intraday technical support is seen at the level of $1,372, $1,358 and $1,345 and the technical resistance is located at $1,402 and $1,407.
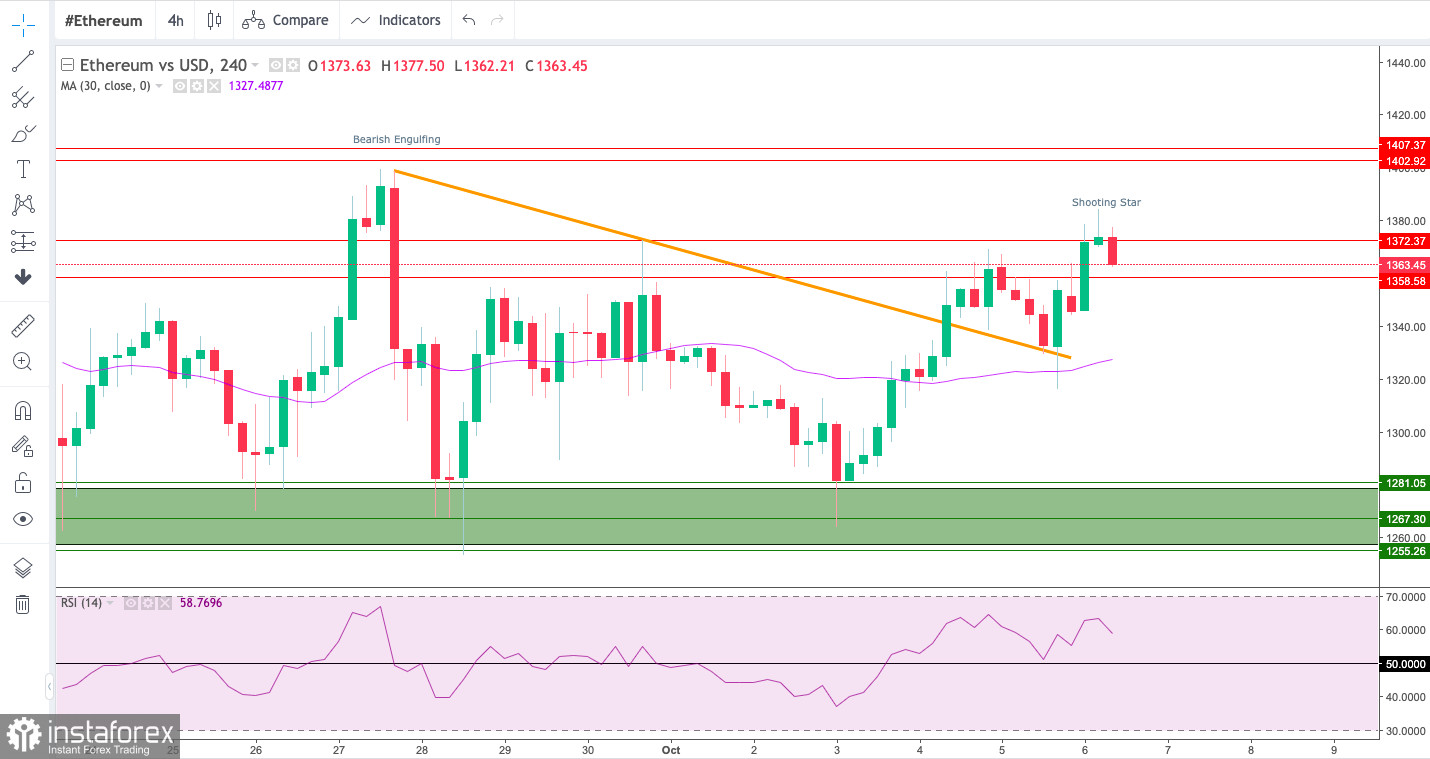
Weekly Pivot Points:
WR3 - $1,360
WR2 - $1,320
WR1 - $1,306
Weekly Pivot - $1,283
WS1 - $1,268
WS2 - $1,245
WS3 - $1,206
Trading Outlook:
The Ethereum market has been seen making lower highs and lower low since the swing high was made in the middle of the August at the level of $2,029. The key technical support for bulls is seen at $1,281 as a part of the demand zone located between the levels of $1,252 - $1,295. If the down move will be extended, then the next target for bears is located at the level of $1,000.
Add new comment