Elliott Wave Forecast: Nvidia Stocks (NVDA) Reacting Lower Perfectly From Blue Box Area
 In this technical blog, we will look at the past performance of 1-hour Elliott Wave Charts of NVDA. In which, the decline from 05 August 2022 high is unfolding as an impulse sequence and showed a lower low sequence within the bigger cycle from November 2021 peak. Therefore, we knew that the structure in NVDA is incomplete to the downside & should see more weakness. So, we advised members to sell the bounces in 3, 7, or 11 swings at the blue box areas. We will explain the structure & forecast below:
 Good day Traders and Investors. In today’s article, we are going to follow up on Nio Inc. ($NIO) forecast posted back in Feb 2022 and take a look at the latest count. Nio (NYSE: NIO) is a Chinese multinational automobile manufacturer with headquarters in Shanghai. It specializes in designing and developing electric vehicles. Nio tries to distinguish itself by innovating in two key areas which are battery technology and self-driving software. The company offers modular batteries for an easy swap in minutes. It also offers Battery-as-a-Service (BaaS) which allows customers to subscribe for car batteries rather than paying for them upfront.
 Short term Elliott Wave view on S&P 500 E-mini Futures (ES) suggests pullback from 8.17.2022 high is in progress as a zigzag Elliott Wave structure. Down from 8.17.2022 high, wave A ended at 3903.50. Wave B rally is currently in progress to correct cycle from 8.17.2022 high before the Index turns lower. Internal subdivision of wave B is unfolding as an expanded Flat structure.
 Hello fellow traders. In this technical article we’re going to take a quick look at the Elliott Wave charts of Amazon stock. We have been calling for the rally in the stock due to impulsive bullish sequences in the cycles from the June lows. Consequently, we recommended members to avoid selling the stock, while keep favoring the long side in near term. In the further text we are going to explain the Elliott Wave Forecast.
 Short term Elliott Wave view on Amazon Stocks (AMZN) suggests the decline to $123.66 ended wave ((A)). Wave ((B)) rally is in progress with internal subdivision as a double three Elliott Wave structure. Up from wave ((A)) low at $123.66, wave A ended at $128.50 and pullback in wave B ended at $127.18. Final leg higher wave C ended at $131.38 which completed wave (W). The stock then pullback in wave (X) with internal subdivision as a zigzag.
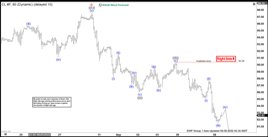 Decline in Oil (CL) from 7.20.2022 high is unfolding as a zigzag Elliott Wave structure. Down from July 20, wave A ended at 87.01 and wave B rally ended at $97.66. Oil has resumed lower in wave C with subdivision as a 5 waves impulse. Down from wave B, wave (i) ended at $88.27 and wave (ii) bounce ended at $91.61. Oil resumed lower in wave (iii) towards $87.12, wave (iv) ended at $88.63, and final leg lower wave (v) ended at $85.98. This completed wave ((i)) of C.
 Caterpillar Inc. ($CAT) is an American Fortune 100 corporation that designs, develops, engineers, manufactures, markets, and sells machinery, engines, financial products, and insurance to customers via a worldwide dealer network. It is the world’s largest construction-equipment manufacturer. Caterpillar stock is a component of the Dow Jones Industrial Average.
 Short Term Elliott Wave View in XAUUSD suggests rally to 1765.59 ended wave 2. Wave 3 lower is in progress to complete a cycle from August 10th, 2022 high. Internal subdivision of wave 2 unfolded as a double three Elliott Wave structure. Up from wave 1, wave (a) ended at 1743.85 and pullback in wave (b) ended at 1730.00. Gold extended higher in wave (c) of ((w)) towards 1754.02. Connector wave ((x)) completed as a zigzag correction at 1741.81. The metal then resumed the rally in wave (a) ended at 1755.92 and pullback in wave (b) finished at 1746.72. Final leg higher wave (c) ended at 1765.59 which ended wave ((y)) of 2.
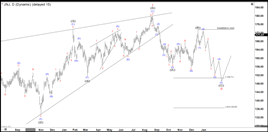 Johnson & Johnson (JNJ) is an American multinational corporation founded in 1886 that develops medical devices, pharmaceuticals, and consumer packaged goods. Its common stock is a component of the Dow Jones Industrial Average, and the company is ranked No. 36 on the 2021 Fortune 500 list of the largest United States corporations by total revenue. Johnson & Johnson is one of the world’s most valuable companies and is one of only two U.S.-based companies that has a prime credit rating of AAA, higher than that of the United States government.