Short term Elliott Wave view on SPDR S&P 500 (ticker: SPY) suggests the ETF shows a bearish sequence from 8.17.2022 high favoring further downside. The decline lower from 8.17.2022 high is unfolding as a zigzag Elliott Wave structure. Down from 8.17 high, wave A ended at 390.04. Wave B corrective rally unfolded as an expanded Flat structure.
Up from wave A, wave ((a)) ended at 401.56, and dips in wave ((b)) ended at 388.42. Wave ((c)) higher ended at 415 which completed wave B.
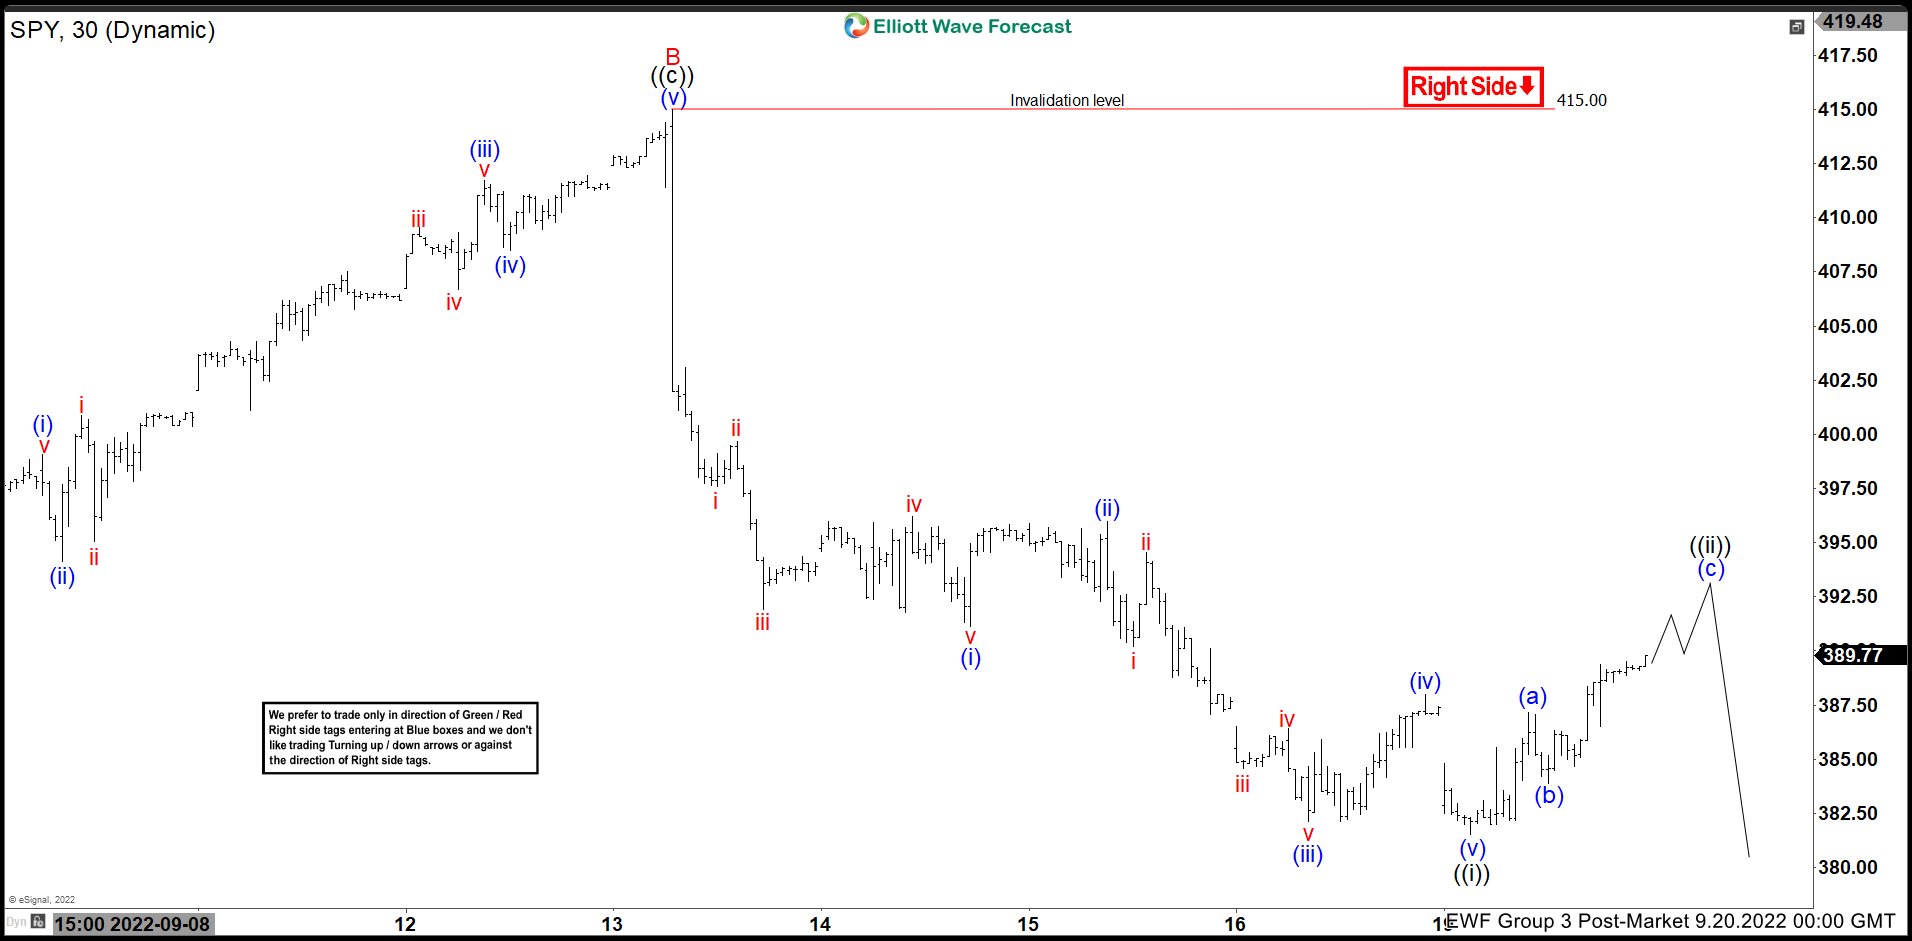
Wave C lower is currently in progress with subdivision as a 5 waves impulse. Down from wave B, wave (i) ended at 391.12, and wave (ii) rally ended at 395.96. The ETF extended lower in wave (iii) towards 382.12, and wave (iv) rally ended at 388. Final leg lower wave (v) ended at 381.50 which completed wave ((i)) of C.
Wave ((ii)) corrective rally is now in progress to correct cycle from 9.13.2022 peak in 3, 7, or 11 swing before the decline resumes. Wave ((ii)) rally is proposed to take the form of a zigzag structure. Up from wave ((i)), wave (a) ended at 387.16 and wave (b) pullback ended at 383.89. Final leg higher wave (c) should end somewhere at 389.4 – 392.9 area to complete wave ((ii)) before the ETF resumes lower.
SPY 30 Minutes Elliott Wave Chart