Short term Elliott Wave view in Dollar Index suggests rally to 105.78 ended wave (1). Wave (2) pullback ended at 103.41 with subdivision as a zigzag Elliott Wave structure. Down from wave (1), wave A ended at 104.66 and wave B ended at 105.49. Index extended lower in wave C towards 103.41 to complete wave (2). Index has resumed higher in wave (3), but it still needs to break above wave (1) at 105.78 to validate this view and rule out a double correction in wave (2).
Internal subdivision of wave (3) is unfolding as a 5 waves impulse structure. Up from wave (2), wave ((i)) ended at 105.08, and dips in wave ((ii)) ended at 103.67. Index then resumes higher in wave ((iii)) towards 105.54, and pullback in wave ((iv)) ended at 104.64. Final leg higher wave ((v)) ended at 105.63 which completed wave 1. Pullback in wave 2 ended at 104.81 with internal subdivision as a zigzag in lesser degree. Down from wave 1, wave ((a)) ended at 104.95, wave ((b)) ended at 105.16, and wave ((c)) ended at 104.81. Near term, while dips stay above 103.41, expect the Index to extend higher.
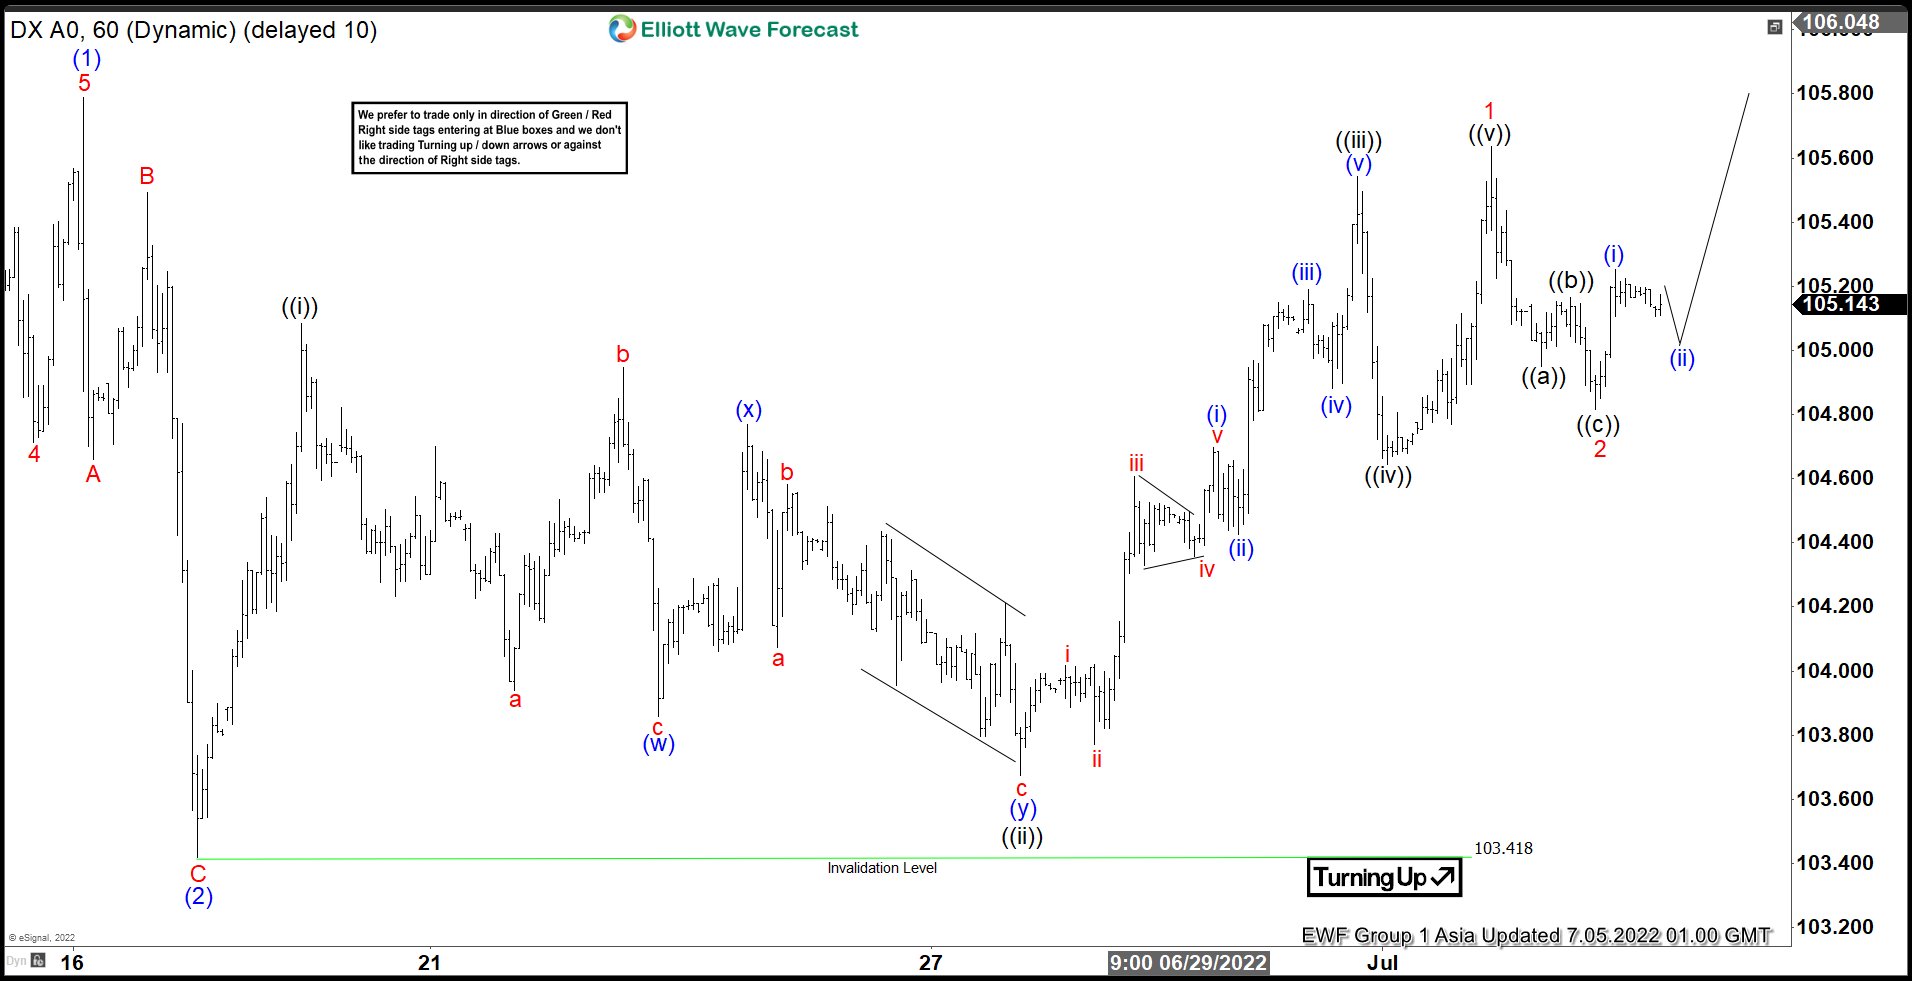
DXY 60 Minutes Elliott Wave Chart