
The NASDAQ-100 is an index that is constituted by 100 of the largest companies listed on the NASDAQ stock exchange, which is the second largest in the world only after the New York Stock Exchange by market capitalization. The companies that are listed in this index range from a variety of industries like Technology, Telecommunications, Biotechnology, Media, and Services. The NASDAQ-100 was first calculated in January 31 of 1985 by NASDAQ and it is a modified capitalization-weighted index. This index has been of good reference to investors that want to know how the stock market is performing without financial services companies, this given that the index excludes financial companies.
Simple and lightweight NASDAQ Index Futures Live Chart is a powerful free tool that allows you to easily conduct technical analysis online without downloading additional files and applications. In order to meet the needs of the most demanding technical analysts, you can find over a hundred chart analysis tools on our NASDAQ Index Futures chart. You can also add any of 80 technical indicators directly to the chart online - in two clicks. The possibilities are endless!
Technical Analysis NASDAQ Index Futures
NASDAQ Index Futures Technical Analysis widget is a modern handy tool that shows ratings based on technical indicators data. The design of the widget is made in the form of a speedometer, thanks to which you can quickly see the results of the summary technical analysis. You no longer need to use many indicators for analyzing financial instruments, the widget will do it for you. In addition, all rating data are updated in real time. These technical indicators are used for technical analysis: Relative Strength Index, Stochastic, Commodity Channel Index, Average Directional Index, Awesome Oscillator, Momentum, MACD, Stochastic RSI, Williams Percent Range, Bull Bear Power, Ultimate Oscillator, Exponential Moving Average, Simple Moving Average, Ichimoku Cloud Base Line, Volume Weighted Moving Average, Hull Moving Average.
Trade Equity Index Futures
Investing in Equity Index Futures is a way to gain access to price movements on an underlying Index, and to be able to buy and sell the underlying financial instrument at a fixed price on a future date. By trading Equity Index Futures, which are based on global benchmark Indices such as the Dow Jones, Nasdaq, S&P, and Russell 2000, you may have the opportunity to potentially benefit from price movements of multiple equities without trading them one-by-one. Trade Index Futures with as little as $100 you can get to trading! Explore the app!What Is an Equity Index and How Does It Work?
Over the past couple of years, equity indices have grown in popularity as investors and traders seek to gain exposure to a plethora of companies’ price swings without having to trade each stock individually.So what are indices exactly, how does a stock index work and how is it calculated? Here’s what you need to know about equity indices:
Equity Index Defined: What Is an Equity Index?
In short, an equity index is a compilation of stocks from different or similar market segments. The stocks are compiled together based on factors such as market capitalization, geography, or market sector among other things.
How Do Equity Indices Reflect Market Performance and Trends?
Indices can be useful tools to traders as they give them an overview of market performance. This is because stock indices gauge how certain sectors function as a whole which means that traders do not have to look at individual stocks to do so.
Traders may also use equity indices, such as the S&P 500 to compare their portfolio to the index. In addition, investors may want to get a better grasp on a particular stock sector or want to outperform it, referring to sector indices.
Significance of Equity Indices
Equity indices can be significant due to the fact that they are good indicators of overall market sentiment, they can be used by traders to measure their portfolios’ and investments’ performances, and they can help traders diversify their portfolios.
Trading Equity Indices
Given the important and helpful role they play, traders and investors may naturally seek ways to invest in equity indices. Investing and trading indices can be conducted through various methods, including CFDs and ETFs which may be suitable for traders looking for short-term gains.
On the other hand, those seeking to profit in the long run may find Equity Index Futures more attractive.
What Are Equity Index Futures?
Equity index Futures are derivative agreements between two parties that allow them to speculate on the future prices of the underlying index in question. These contracts obligate the involved parties to settle the contract at a predetermined price in the future. You can find out how Futures contracts work in our article “What Are Futures and How to Trade Them?”
To conclude, equity indices may be a good solution for traders and investors seeking to gain exposure to various stocks and market sectors without having to trade each stock on its own. These may also be a good way for traders to gauge the overall performance of the market and certain stock sectors. Plus500’s Futures trading platform offers Futures contracts on equity indices.
About NASDAQ Composite
Despite the fact that the NASDAQ Composite is actively used to analyze the quotations of securities of the high-tech sector, it includes companies from a wide variety of industries. Its value is calculated based on all issuers whose stocks are listed on the NASDAQ exchange.The absence of a capitalization requirement leads to an interesting effect - there are both industry giants and small companies in the NASDAQ index basket.
At the initial stage, the capitalization requirement was not introduced so that young IT companies could get into the basket. As a result, the basket of the NASDAQ Composite index includes both Apple with a capitalization of over $ 3 trillion, and, for example, the little-known Cemtrex with a capitalization of only a few million dollars.
The NASDAQ Composite index includes representatives of the medical sector, the biotechnology sector, companies working on space exploration, in the aircraft industry. There are representatives of the financial sector, the service sector.
Accordingly, now the index includes securities of more than 2,500 companies, only a part of which belongs to the high-tech sector. NASDAQ Composite futures contracts are traded on the Chicago Mercantile Exchange (CME).
The NASDAQ Composite Index has been calculated since 1971. When the index was created, NASDAQ was the only electronic trading platform in the world. This led to an emphasis on the high-tech sector and helped attract such companies as Oracle, Dell, Apple. The value of the index began at 100 points, at that time the Nasdak index included only 50 companies.
The composition of any index is not a static value, it is constantly being adjusted, new companies are added, and those that do not meet the requirements are removed.
The index is calculated at the weighted average prices of all its components. This means that the largest companies in terms of capitalization are able to exert the most significant influence on the value of the NASDAQ Composite.
On the Chicago Mercantile Exchange, E-mini Nasdaq Composite Futures are ticked with the ticker symbol QCN. Their volume is equal to the value of the underlying index multiplied by $ 20.
Unlike the S&P 500 and the like, the NASDAQ index includes securities of issuers from several countries, which is why it is considered global. It mainly includes stocks of fast-growing companies traded on the NASDAQ. The most famous of them include: Adobe, Apple, com, Cisco, Columbia Sportswear, Dropbox, eBay, Expedia, Meta, GoPro Inc, Hasbro, Intel, Logitech, Marriott, Marvel, Microsoft, Nasdaq Inc, Netflix, NVIDIA, Paypal, Papa John’s, Qualcomm, Seagate, Silicon Labs, Starbucks, Tesla, TESSCO, TripAdvisor, Western Digital.
Changes to the NASDAQ list are made frequently - when new companies are listed on the exchange. However, the most significant elements of the index, as a rule, remain practically unchanged.
The NASDAQ Composite rate is calculated taking into account the "weight" of the shares of each company, that is, the larger the capitalization, the more it affects the result of the calculation. The index is calculated by analogy with the weighted moving average.
The stocks price is multiplied by their number, the results are summed up and divided by a special divisor. Division is necessary to bring the value of the NASDAQ index to a convenient value for reporting.
Recalculation is performed every second. At the end of each trading session, the last value of the index is published at 04:16 p.m. Eastern Time (GMT-04: 00).
NASDAQ Composite is just one of a large family of indices of the exchange with the same name. In addition to the summary indicator, it also includes:
NASDAQ 100 (NDX) - is a global index that includes 100 high-tech companies from the USA, Canada, Israel, Singapore, India, Sweden, Switzerland, Ireland and China.
NASDAQ Biotecnology Index (NBI) - is an American index calculated on the basis of pharmaceutical and biotechnology companies' securities.
NASDAQ US Small Cap - is an index that includes small-cap companies listed on the same-name stock exchange.
NASDAQ US 1500 - is an integral part of the previous index, which includes up to 1500 of the largest companies in the small-cap segment.
NASDAQ Internet - is an index consisting of securities of issuers operating in the field of Internet business and listed on the NASDAQ or NYSE.
NASDAQ Insurance - is an index that includes NASDAQ-listed securities of companies from the insurance industry.
NASDAQ Computer (IXCO) - is an industry index based on issuers from the exchange of the same name operating in the industry of computer services and equipment, the Internet, software and semiconductors.
NASDAQ Transportation - this index includes the securities of airlines and transport companies.
NASDAQ Telecommunications - is an industry index that includes shares of issuers from the field of telecommunications and the production of related equipment.
NASDAQ Industrials (INDS) - the focus is on industrial companies.
NASDAQ Bank Index (BANK) - calculated for companies operating in the banking sector.
NASDAQ Global Equity Index (NQGI) - the focus is on the largest companies in the world, the index basket consists of more than 9000 instruments.
NASDAQ PHLX Semiconductor (SOX) - compiled based on the value of stocks of companies involved in the production of semiconductors.
This is not a complete list of indices from NASDAQ, in addition to those listed there are families of indices dedicated to emerging markets, dividend companies, "green" companies (working to reduce environmental damage).
Let's also note the so-called smart indices, which allow identifying the most liquid sectors of the economy. There are also commodity indices created for grain, oil, gold and other commodity market instruments.
Traders can trade with:
- IXIC futures;
- options on futures on the NASDAQ Composite and other sub-indices.
You can also invest in ETFs that copy the NASDAQ index. For example, an ETF with the ONEQ ticker offers a management fee of just 0.21% - a good option for long-term investment. Other ETFs include:
- Invesco QQQ Trust (QQQ) – копирует NASDAQ 100.
- iShares Nasdaq Biotechnology ETF (IBB) - copies another NASDAQ Biotechnology Index sub-index.
- First Trust NASDAQ 100 Technology (QTEC) - Copies the NASDAQ 100 sub-index.
The NASDAQ Composite remains in fact the largest high-tech index in the world. It is very sensitive to crisis phenomena, but it allows you to earn money through prolonged periods of growth.
Comments
Submitted by Anonymous on Fri, 03/29/2024 - 14:42
NASDAQ Futures Forecast
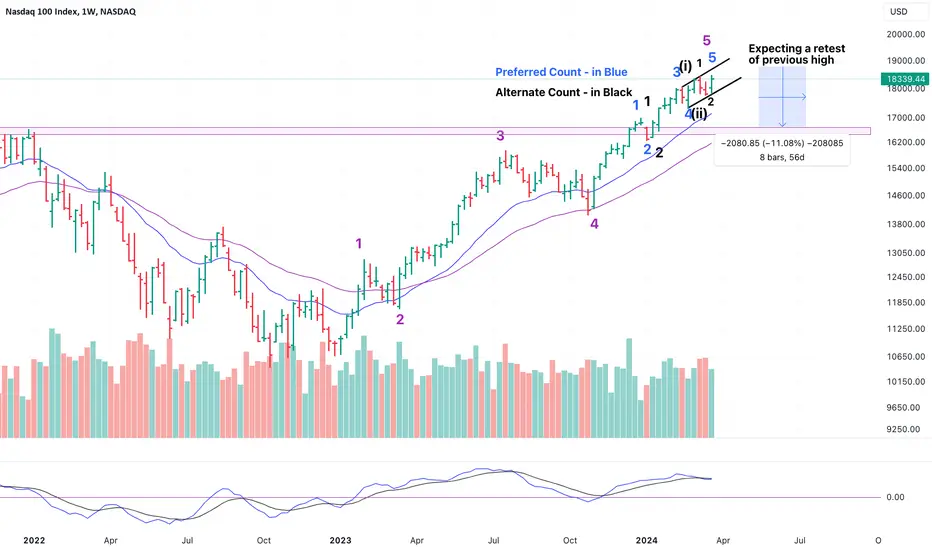
Nasdaq has done really well in last 15 months - rallied 70% since Jan '23 and 30% since Oct '23.
EW counts suggest that we are close to the end of a weekly impulse.
There are 2 alternatives counts - however, my bias is with the blue one, which suggests that there is a correction around the corner.
Reason is that there is a topping structure on daily chart.
However, the time for the topping structure to play out is anybody's guess.
My hunch is that it should happen in next one week (for reference check BTC chart for last 2 weeks - expecting a similar breakdown).
Submitted by Anonymous on Tue, 03/05/2024 - 15:41
NASDAQ FORECAST
I will be selling nasdaq from that point to 17500 as TP 1 and 17000 as TP 2. Limit set already, use risk and money management. Goodluck!
Submitted by Anonymous on Thu, 09/22/2022 - 13:03
Elliott Wave Forecast: Nasdaq (NQ) Further Downside Expected
Short term Elliott Wave view on Nasdaq (NQ) suggests the decline from 8.17.2022 high is unfolding as a zigzag Elliott Wave structure. Down from 8.17 high, wave A ended at 12017.75. Wave B ended at 12986.74 with internal subdivision as an expanded flat. Up from wave A, wave ((a)) ended at 12461.50 and dips in wave ((b)) ended at 11921.50. Wave ((c)) higher ended at 12986.74 which also completed wave B.
Index has turned lower in wave C with internal subdivision as a 5 waves impulse. Down from wave B, wave ((i)) ended at 11778.50 and rally in wave ((ii)) ended at 12143.34. Internal subdivision of wave ((ii)) unfolded as an expanded flat.
Up from wave ((i)), wave (a) ended at 12092.50, wave (b) ended at 11763.25, and wave (c) ended at 12143.34. This completed wave ((ii)) of C. Index has resumed lower in wave ((iii)). Near term, expect wave (i) of ((iii)) to end soon. Index should then rally in wave (ii) to correct cycle from 9.22.2022 high (12143.34) before it resumes lower.
As far as pivot at 12143.34 stays intact, expect rally to fail in 3, 7, or 11 swing for further downside. Potential target lower is 100% – 161.8% Fibonacci extension of wave ((i)) which comes at 10195 – 10938.
Nasdaq 60 Minutes Elliott Wave Chart
Submitted by Anonymous on Mon, 08/15/2022 - 17:12
Elliott Wave View: Nasdaq (NQ) May See 3 Waves Pullback Soon
Short Term Elliott Wave View suggests rally from 6.17.2022 low is unfolding as a zigzag Elliott Wave structure. Up from 6.17.2022 low, wave A ended at 12262 and pullback in wave B ended at 11507. 13. Wave C higher is in progress as a 5 waves impulse structure. Up from wave B, wave ((i)) ended at 12698.50 and pullback in wave ((ii)) ended at 12072. Index then resumes higher in wave ((iii)) towards 13108.75, and dips in wave ((iv)) ended at 12814.75.
Index can see a little bit more upside to end wave ((v)) of C. This would also complete wave (W) in larger degree and end cycle from 6.17.2022 low. Afterwards, it should correct the rally from 6.17.2022 low in larger degree 3 , 7, or 11 swing within wave (X) before Index then resumes higher again. Nasdaq is currently already at the 100% – 161.8% Fibonacci extension from 6.17.2022 low which comes at 12728 – 13473. Ideally wave (W) ends somewhere within this area before the larger pullback in wave (X). If the Index continues to extend to 13473 or higher, there’s a higher chance the rally from 6.17.2022 will become impulsive 5 waves instead of a zigzag.
Nasdaq 60 Minutes Elliott Wave Chart
Submitted by Anonymous on Thu, 06/23/2022 - 20:56
Elliott Wave View: Further Downside in Nasdaq
Nasdaq ($NQ) 60 Minutes Elliott Wave Chart
NASDAQ ($NQ) broke below previous low on 5/20/2022 at 11490.50 and opens up a bearish sequence favoring further downside. The entire decline from 11/22/2021 high is unfolding as a zig zag Elliott Wave structure.
A zig zag structure is a 3 swing corrective structure where A, B, and C subdivides into 5-3-5 waves. Down from 11/22/2021 high, wave ((A)) ended at 13024.50, and rally in wave ((B)) as expanded flat ended at 15275.75. Index then extended lower with subdivision as an impulse in wave ((C)). Wave ((C)) has internal subdivision of 5 waves.
The 60 minutes chart below shows the decline from wave (2) of ((C)) high unfolded as an impulse Elliott Wave structure to complete wave (3) of ((C)). Down from 12966.37, wave 1 ended at 12412.14 and rally in wave 2 ended at 12786.04 Index then extended lower in wave 3 towards 11235.06.
Rally in wave 4 finished at 11794.52 and last push lower to complete wave 5 of (3) ended at 11068.88. Currently the Index is rallying in 3 swing higher in wave (4) before the decline resumes as far as pivot at 12966.37 stays intact.