Definition
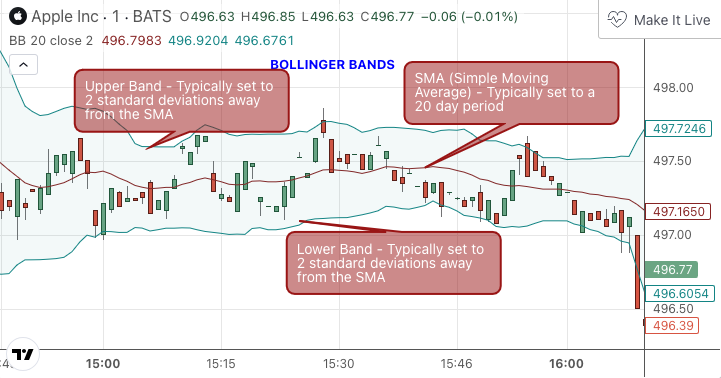
Bollinger Bands (BB) are a widely popular technical analysis instrument created by John Bollinger in the early 1980’s. Bollinger Bands consist of a band of three lines which are plotted in relation to security prices. The line in the middle is usually a Simple Moving Average (SMA) set to a period of 20 days (The type of trend line and period can be changed by the trader; however a 20 day moving average is by far the most popular). The SMA then serves as a base for the Upper and Lower Bands. The Upper and Lower Bands are used as a way to measure volatility by observing the relationship between the Bands and price. Typically the Upper and Lower Bands are set to two standard deviations away from the SMA (The Middle Line); however the number of standard deviations can also be adjusted by the trader.
History
Bollinger Bands (BB) were created in the early 1980’s by financial trader, analyst and teacher John Bollinger. The indicator filled a need to visualize changes in volatility which is of course dynamic, however at the time of the Bollinger Band’s creation, volatility was seen as static.
Calculation
There are three bands when using Bollinger Bands
Middle Band – 20 Day Simple Moving Average
Upper Band – 20 Day Simple Moving Average + (Standard Deviation x 2)
Lower Band – 20 Day Simple Moving Average - (Standard Deviation x 2)
The basics
The Bollinger Bands indicator is an oscillator meaning that it operates between or within a set range of numbers or parameters. As previously mentioned, the standard parameters for Bollinger Bands are a 20 day period with standard deviations 2 steps away from price above and below the SMA line. Essentially Bollinger Bands are a way to measure and visualize volatility. As volatility increases, the wider the bands become. Likewise, as volatility decreases, the gap between bands narrows. What is done with this information is up to the trader but there are a few different patterns that one should look for when using Bollinger Bands.
What to look for
High/Low Prices
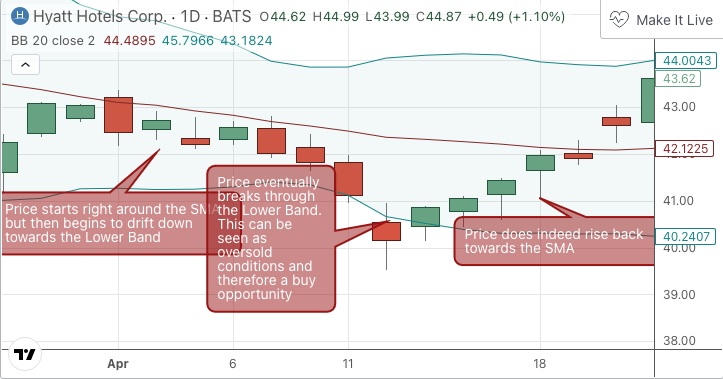
One thing that must be understood about Bollinger Bands is that they provide a relative definition of high and low. Prices are almost always within the band. Therefore, when prices move up near the upper band or even break through the upper band, many traders would see that security as being overbought. This would preset a possible selling opportunity. Of course the opposite would also be true. When prices move down near the lower band or even break through the lower band, that security may be seen as oversold and a buying opportunity may be at hand.
Cycling Between Expansion and Contraction
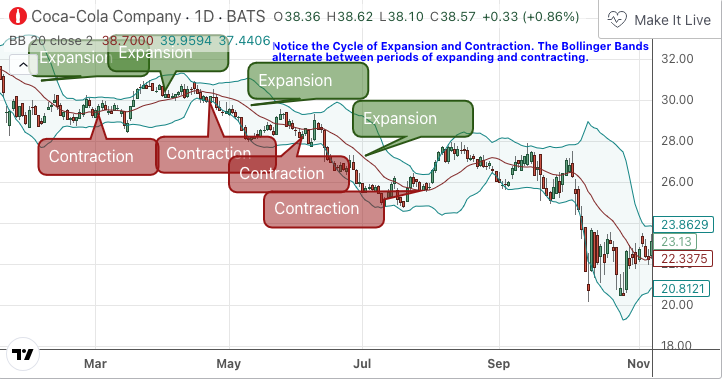
Volatility can generally be seen as a cycle. Typically periods of time with low volatility and steady or sideways prices (known as contraction) are followed by period of expansion. Expansion is a period of time characterized by high volatility and moving prices. Periods of expansion are then generally followed by periods of contraction. It is a cycle in which traders can be better prepared to navigate by using Bollinger Bands because of the indicators ability to monitor ever changing volatility.
Price Action Confirmations
Because of Bollinger Bands ability to display a critically important metric (changes in volatility), the indicator is often used in conjunction with other indicators in order to perform some advanced technical analysis. A good example of this is using Bollinger Bands (oscillating) with a Trend Line (not oscillating). As the example below shows, having the two different types of indicators in agreement can add a level of confidence that the price action is moving as expected.
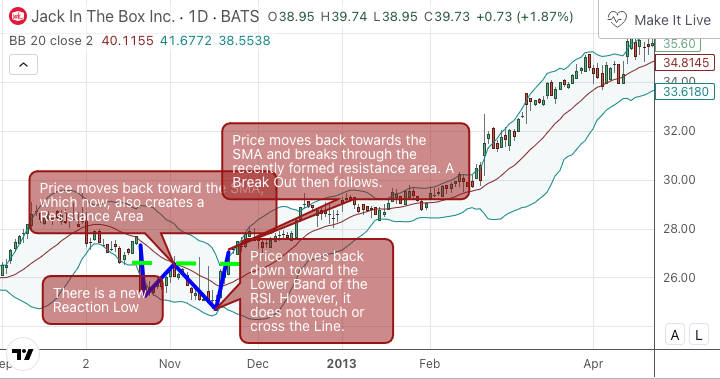
Another good example is using Bollinger Bands to confirm some classic chart patterns such as W-Bottoms. Bollinger often used Bollinger Bands to confirm the existence of W-Bottoms which are a classic chart pattern classified by Arthur Merrill.
In order for the Bollinger Bands to confirm the W-Bottom’s existence, the following four conditions must take place.
- A reaction low forms which may (but not always) break through the Lower Band of the Bollinger Band but it will at least be near it.
- Price move back around the SMA (The Middle Band).
- A second drop in price creates a lower low than the initial reaction low in condition 1 however; the second, new low does not break through the Lower Band.
- A strong move brings price back towards the Middle Band. A breakthrough of a resistance line created by the move in condition 2 may signify a potential breakout.
Walking the Bands
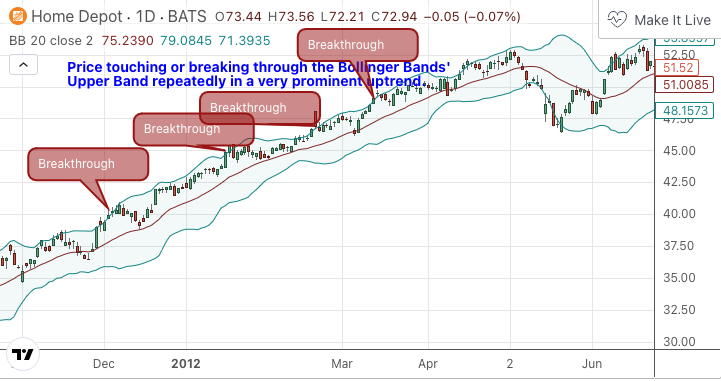
Of course, just like with any indicator, there are exceptions to every rule and plenty of examples where what is expected to happen, does not happen. Previously, it was mentioned that price breaking above the Upper Band or breaking below the Lower band could signify a selling or buying opportunity respectively. However this is not always the case. “Walking the Bands” can occur in either a strong uptrend or a strong downtrend.
During a strong uptrend, there may be repeated instances of price touching or breaking through the Upper Band. Each time that this occurs, it is not a sell signal, it is a result of the overall strength of the move.
Likewise during a strong downtrend there may be repeated instances of price touching or breaking through the Lower Band. Each time that this occurs, it is not a buy signal, it is a result of the overall strength of the move.
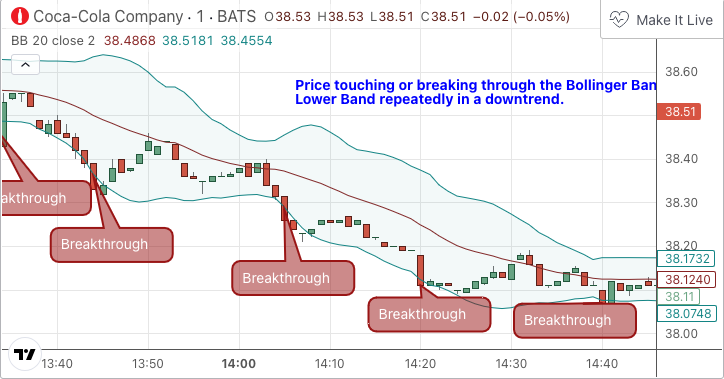
Keep in mind that instances of “Walking the Bands” will only occur in strong, defined uptrends or downtrends.
Summary
Bollinger Bands have now been around for three decades and are still one of the most popular technical analysis indicators on the market. That really says a lot about their usefulness and effectiveness. When used properly and in the proper perspective, Bollinger Bands can give a trader great insight into one of the greatest areas of importance which is shifts in volatility. Traders should of course be aware that Bollinger Bands are not unlike any other indicator in the sense that they are not perfect. A shift in volatility does not always mean the same thing. Knowledge of the causes of these things comes from experimentation and a great deal of experience. Bollinger Bands should be used in conjunction with additional indicators or methods in order to get a better understanding of the ever changing landscape of the market. Ultimately the more pieces of the puzzle that are put together, the more confidence should be instilled in the trader.
Inputs
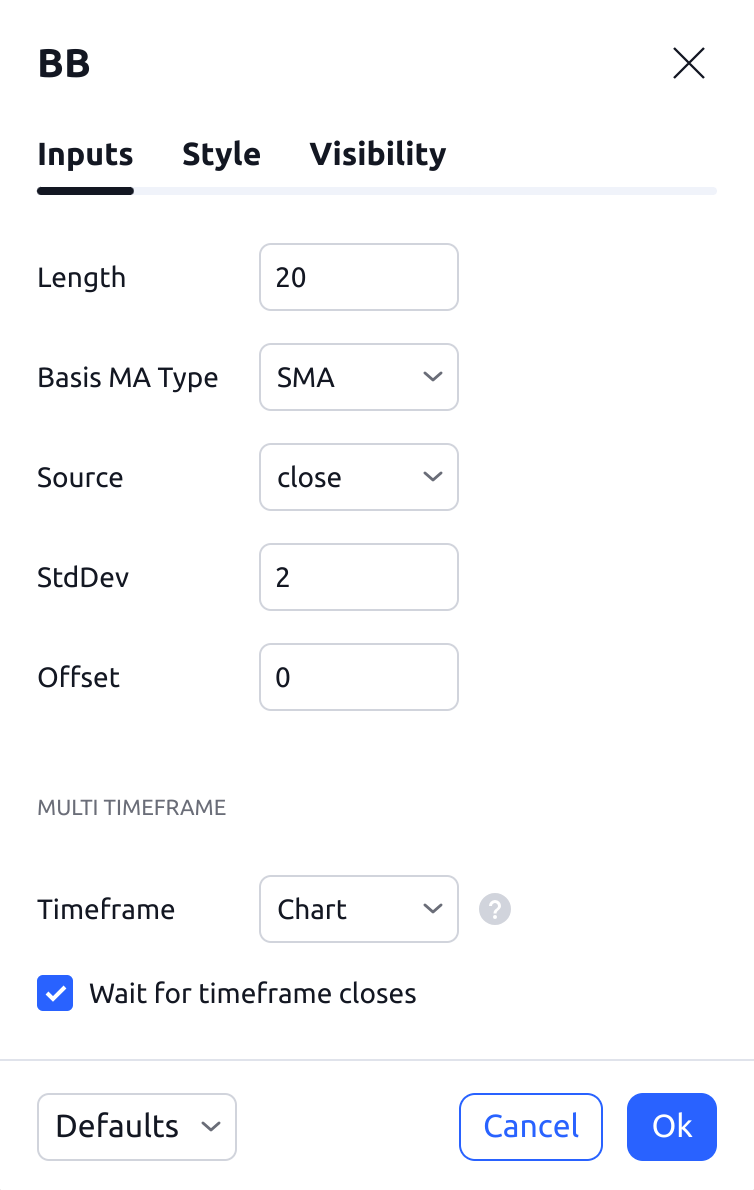
Length
The time period to be used in calculating the SMA which creates the base for the Upper and Lower Bands. 20 days is the default.
Basis MA Type
Determines the type of Moving Average that is applied to the basis plot line.
Source
Determines what data from each bar will be used in calculations. Close is the default.
StdDev
The number of Standard Deviations away from the SMA that the Upper and Lower Bands should be. 2 is the default.
Offset
Changing this number will move the Bollinger Bands either Forwards or Backwards relative to the current market. 0 is the default.
TIMEFRAME
Specifies the timeframe that the indicator is calculated on. This option allows calculating BB based on a data from another timeframe, e.g. having BB calculated on 1H chart be displayed on a 5m chart.
Wait for timeframe closes
Specifies the behavior when the indicator's timeframe is higher than the chart's. When 'Wait for timeframe closes' is checked, higher timeframe values only come in and are interconnected on the chart when the higher timeframe completes.
Style
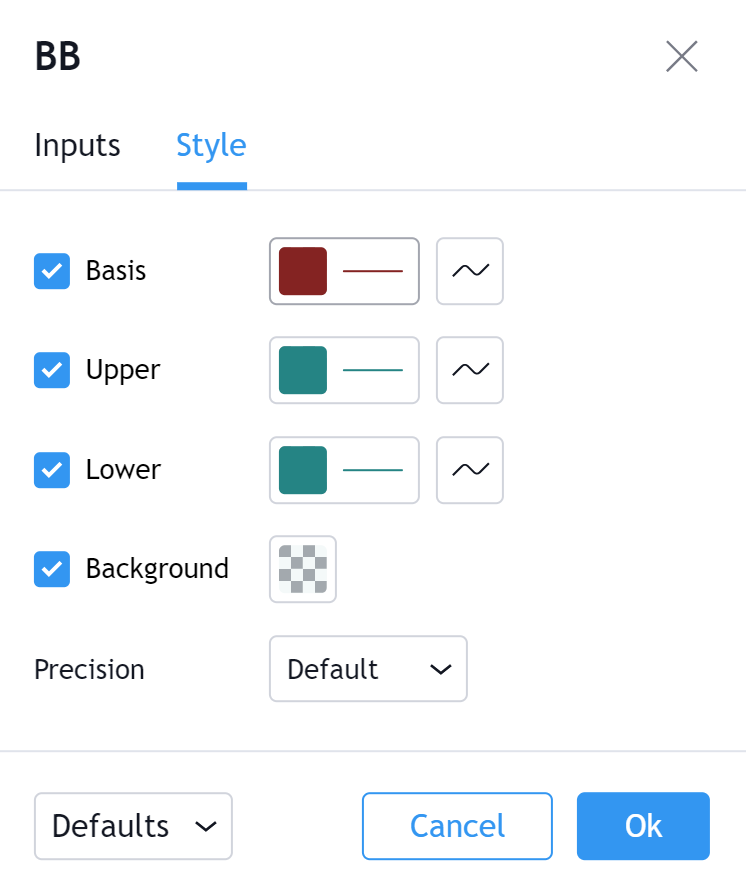
Basis
Can toggle the visibility of the Basis as well as the visibility of a price line showing the actual current price of the Basis. Can also select the Basis' color, line thickness and line style.
Upper
Can toggle the visibility of the Upper Band as well as the visibility of a price line showing the actual current price of the Upper Band. Can also select the Upper Band's color, line thickness and line style.
Lower
Can toggle the visibility of the Lower Band as well as the visibility of a price line showing the actual current price of the Lower Band. Can also select the Lower Band's color, line thickness and line style.
Background
Toggles the visibility of a Background color within the Bands. Can also change the Color itself as well as the opacity.
Bollinger band strategies
Bollinger bands are not suitable for a standalone strategy, they need to be combined with other indicators to make any informed decisions about price volatility.
John Bollinger himself suggests using them with two or even three non-correlated indicators to confirm any signals that they give out. In the rules for using Bollinger bands, he describes the appropriate indicators as momentum, volume, sentiment, open interest and other inter-market data.
So, naturally, some of the best Bollinger band strategies combine the tool with other popular indicators, such as:
- Moving averages
- MACD
- RSI
1. Bollinger band and moving average strategy
Although Bollinger bands already use a moving average, you can apply a longer-term simple moving average – such as a 100 or 200-day – as an overlay to get more insight into the basic price action.
When a market’s price is higher than its moving average, it’s said to be in an uptrend. This means we can look for buy signals. And when the price moves below the moving average, we can look for sell signals.
Looking at the Bollinger bands too, we get further signals depending on how close the bands are to the SMA. For example, when the price crosses the SMA and no part of the Bollinger bands touches the SMA, it’s likely the market will soon correct itself back toward the SMA.
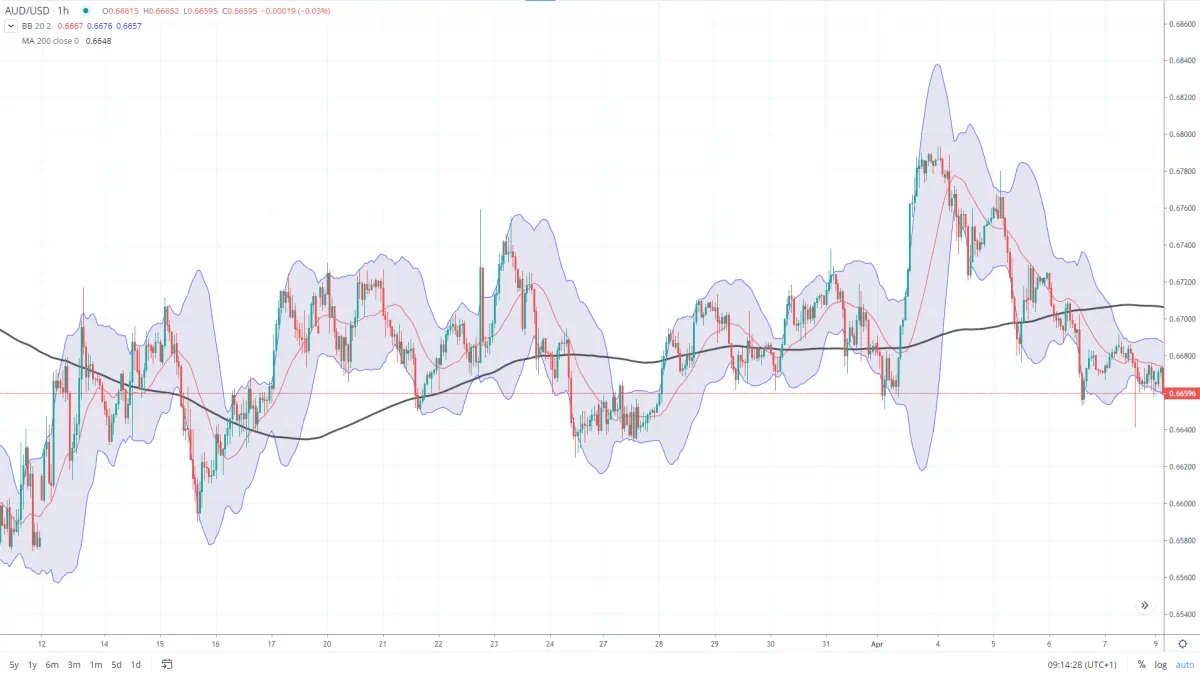
The black line on this chart is a 200-day SMA. As we can see, the Bollinger bands frequently rise and fall back toward this line. Even on longer divergences, the two will eventually meet again.
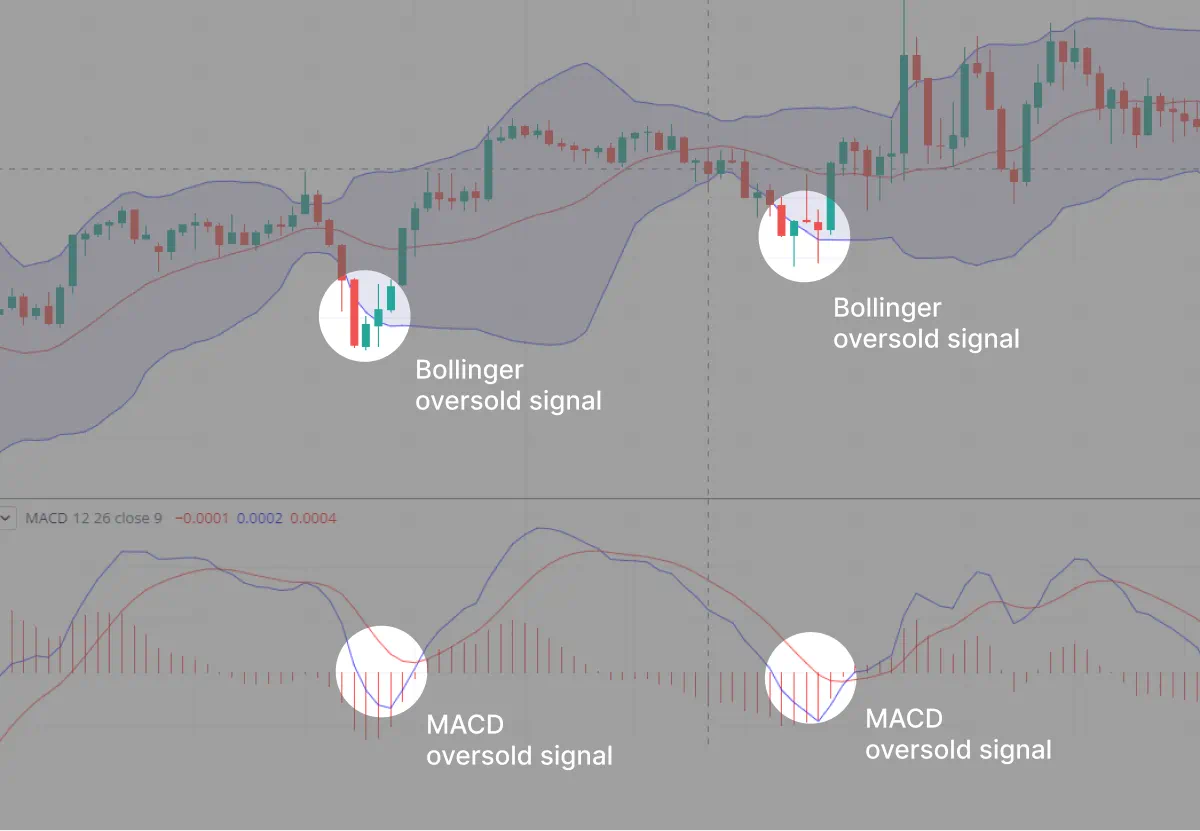
2. Bollinger bands and MACD trading strategy
Another popular strategy is to combine Bollinger bands with the Moving Average Convergence Divergence (MACD) indicator.
Here, traders are looking to identify points where the moving averages of the MACD cross with the histogram displayed below the price chart. And if these signals align with those of the Bollinger bands, it can be taken as confirmation of the position. As we can see on the following chart.
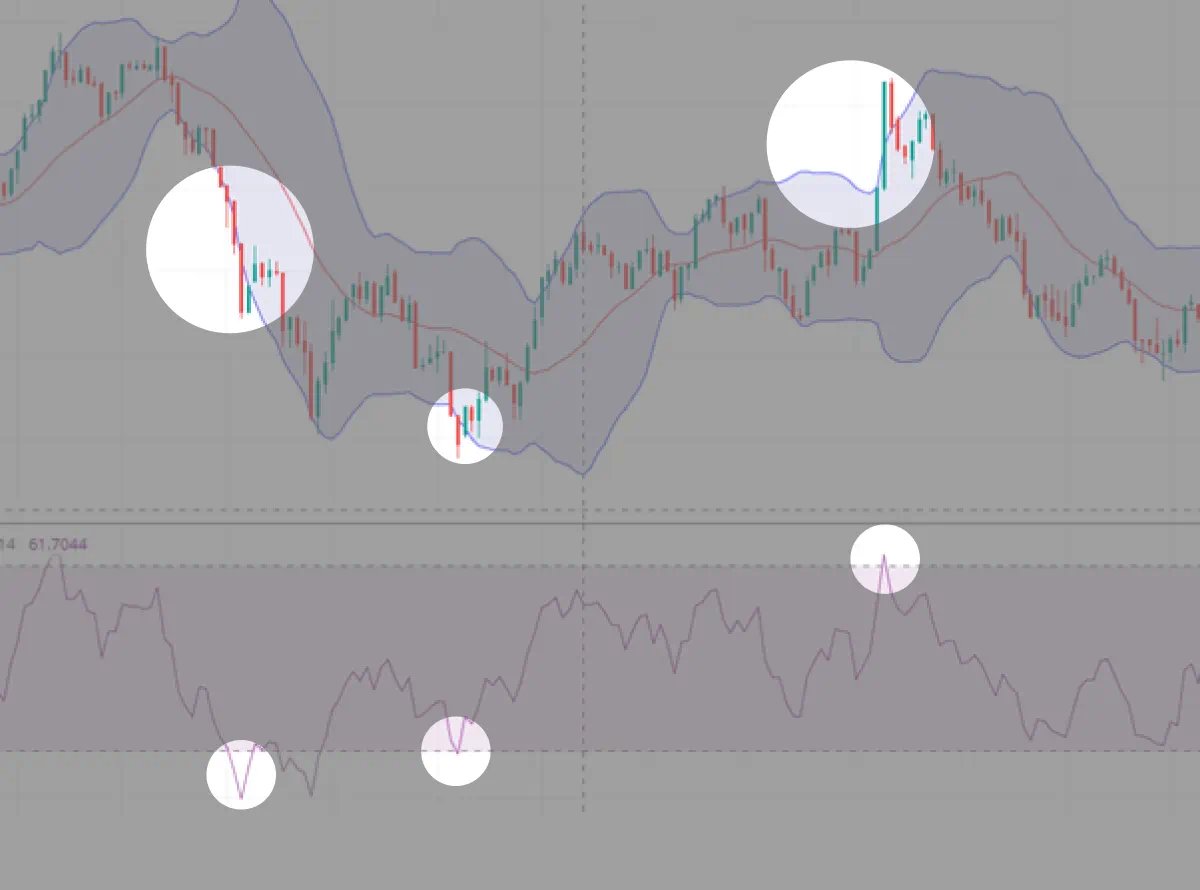
3. Bollinger bands and RSI strategy
The relative strength index (RSI) is a momentum indicator, it displays the speed and strength of price change – which is something Bollinger bands can’t tell us.
The RSI oscillates between 0 and 100. A value above 70 is a signal the market is overbought, and a value below 30 is a signal it’s oversold.
If a market is trading above its Bollinger band, you’d be looking for an overbought signal on the RSI. And if the market is below the bands, you’d be looking to confirm it with an oversold signal on the RSI.
Traders can also look for RSI divergences. When the market reaches higher highs, but the RSI indicator shows a lower high – a bearish divergence – it indicates that the momentum is weak so the market will likely reverse downward.
Conversely, when the market makes lower lows, but the RSI is making a higher low – a bullish divergence – this is a sign of strength and indicates the market could bounce upward.
Try using Bollinger bands risk free
You don’t need to risk capital when you’re building your confidence using Bollinger bands. You can sign up for Demo, and see how they work on real prices but with virtual funds.
Then, when you’re ready, you can start trading on live markets by following these steps:
- Sign up account – it usually takes less than five minutes
- Add some funds, so you can start trading instantly
- Log in to platform and choose your markets
- Load up our advanced charts with your preferred technical tools
- Start trading
Add new comment