In this technical article we’re going to take a look at the Elliott Wave charts charts of Apple AAPL stock. As our members know Apple stock has recently given us recovery against the 176.13 high that has unfolded as Irregular flat pattern. Once the stock completed flat correction, it made decline toward new lows as expected. Before we take a look at the real market example of Expanded Flat, let’s explain the pattern in a few words.
Elliott Wave Expanded Flat Theory
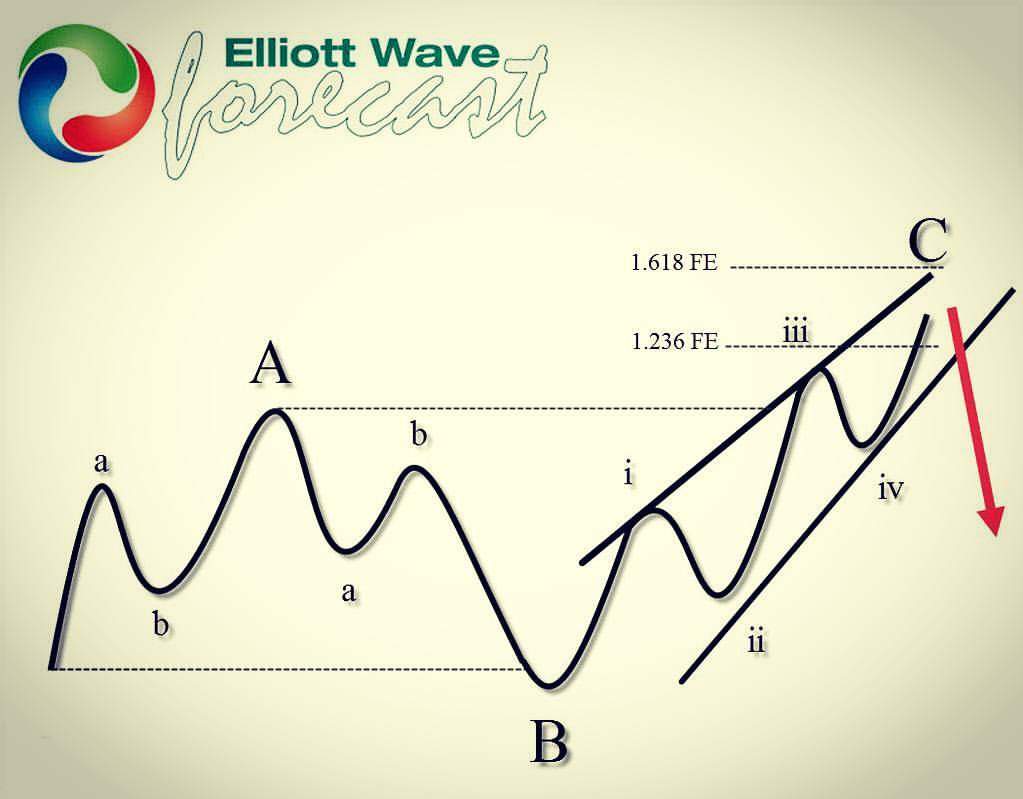
Elliott Wave Flat is a 3 wave corrective pattern which could often be seen in the market nowadays. Inner subdivision is labeled as A,B,C , with inner 3,3,5 structure. Waves A and B have forms of corrective structures like zigzag, flat, double three or triple three. Third wave C is always 5 waves structure, either motive impulse or ending diagonal pattern. It’s important to notice that in Irregular Flat Pattern wave B completes below the starting point of wave A. Wave C ends above the ending point of wave A . Wave C of Flat completes usually between 1.00 to 1.236 Fibonacci extension of A related to B, but sometimes it could go up to 1.618 fibs ext.
At the graphic below, we can see what Expanded Flat structure looks like
Now, let’s take a look what Elliott Wave Flat Pattern looks like in the real market.
Apple AAPL 4h Hour Elliott Wave Analysis 09.12.2022.
The stock has made 5 waves down from the 176.13 peak which suggests cycle from the peak is not done yet. After 3 waves correction we expect to see further decline. Currently AAPL is correcting the cycle from the 176.13 high. Elliott wave view suggests recovery is unfolding as Irregular Flat Pattern. When we downgrade charts to lower time frames , we can see waves inner subdivisions of ( A) and (B) blue are having corrective sequences. Wave B has broken the starting point of (A) while (C) has broken ending point of A which is characteristic of Irregular flat. Wave C red leg should complete as 5 waves soon.

Apple AAPL 4h Hour Elliott Wave Analysis 09.26.2022.
Apple stock ended ((B)) black recovery at 164.25 high and made turn lower as we expected. Eventually the price has broken previous low confirming next leg down is in progress. Now AAPL stock is showing lower low sequences from the 176.13 peak, suggesting further weakness toward 141.54 – 127.07 area.
