Short term Elliott Wave view on Apple Stock (AAPL) suggests that the decline from 8.18.2022 peak is unfolding as a zigzag Elliott Wave structure. Down from 8.18.2022 high, wave ((A)) ended at 153.69 and rally in wave ((B)) ended at 164.90. Internal subdivision of wave ((B)) unfolded as an expanded Flat structure.
Up from wave ((A)), wave (A) ended at 159, dips in wave (B) ended at 152.68, and wave (C) rally ended at 164.90 as a 5 waves impulse. Up from wave (B), wave 1 ended at 156.37 and pullback in wave 2 ended at 154.46. Wave 3 ended at 164.26, wave 4 ended at 163.07, and final leg wave 5 ended at 164.90 which completed wave (C) of ((B)).
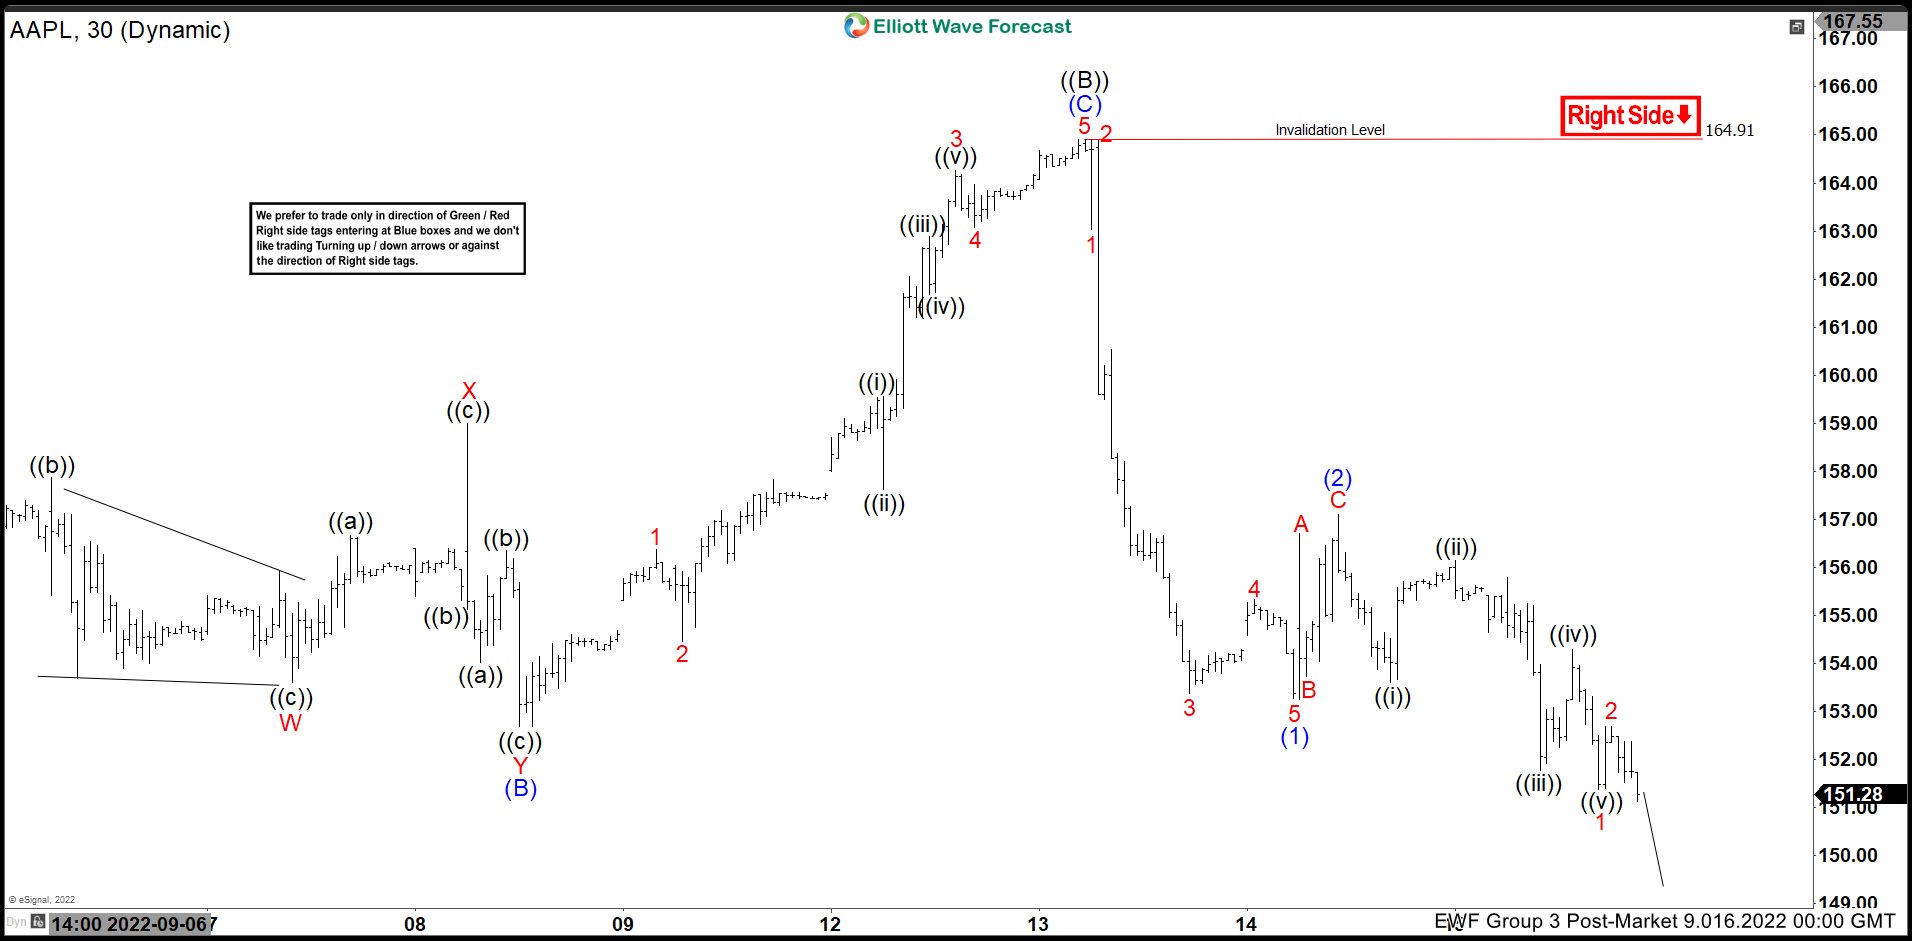
The stock has resumed lower in wave ((C)) which subdivides into another 5 waves in lesser degree. Down from wave ((B)), wave 1 ended at 163.02 and wave 2 ended at 164.89. Stock resumes lower in wave 3 towards 153.37. Wave 4 ended at 155.33, and final leg wave 5 ended at 153.26 which ended wave (1).
Wave (2) corrective rally ended at 157.10 and now stock resumes lower again in wave (3) of ((C)). Near term, while below 157.10, and more importantly below 164.91, expect Apple to resume lower.
AAPL 30 Minutes Elliott Wave Chart