Short term Elliott Wave view on Advanced Micro Devices Stocks (ticker: AMD) shows a bearish sequence from 8.5.2022 high calling for further downside. Decline from 8.5.2022 high is unfolding as a 5 waves impulse. Down from 8.5.2022 high, wave (1) ended at 78.52 and rally in wave (2) ended at 86.05.
Wave (3) lower is in progress with internal subdivision as another 5 waves in lesser degree. The 30 minutes chart below shows the internal subdivision of wave (3).
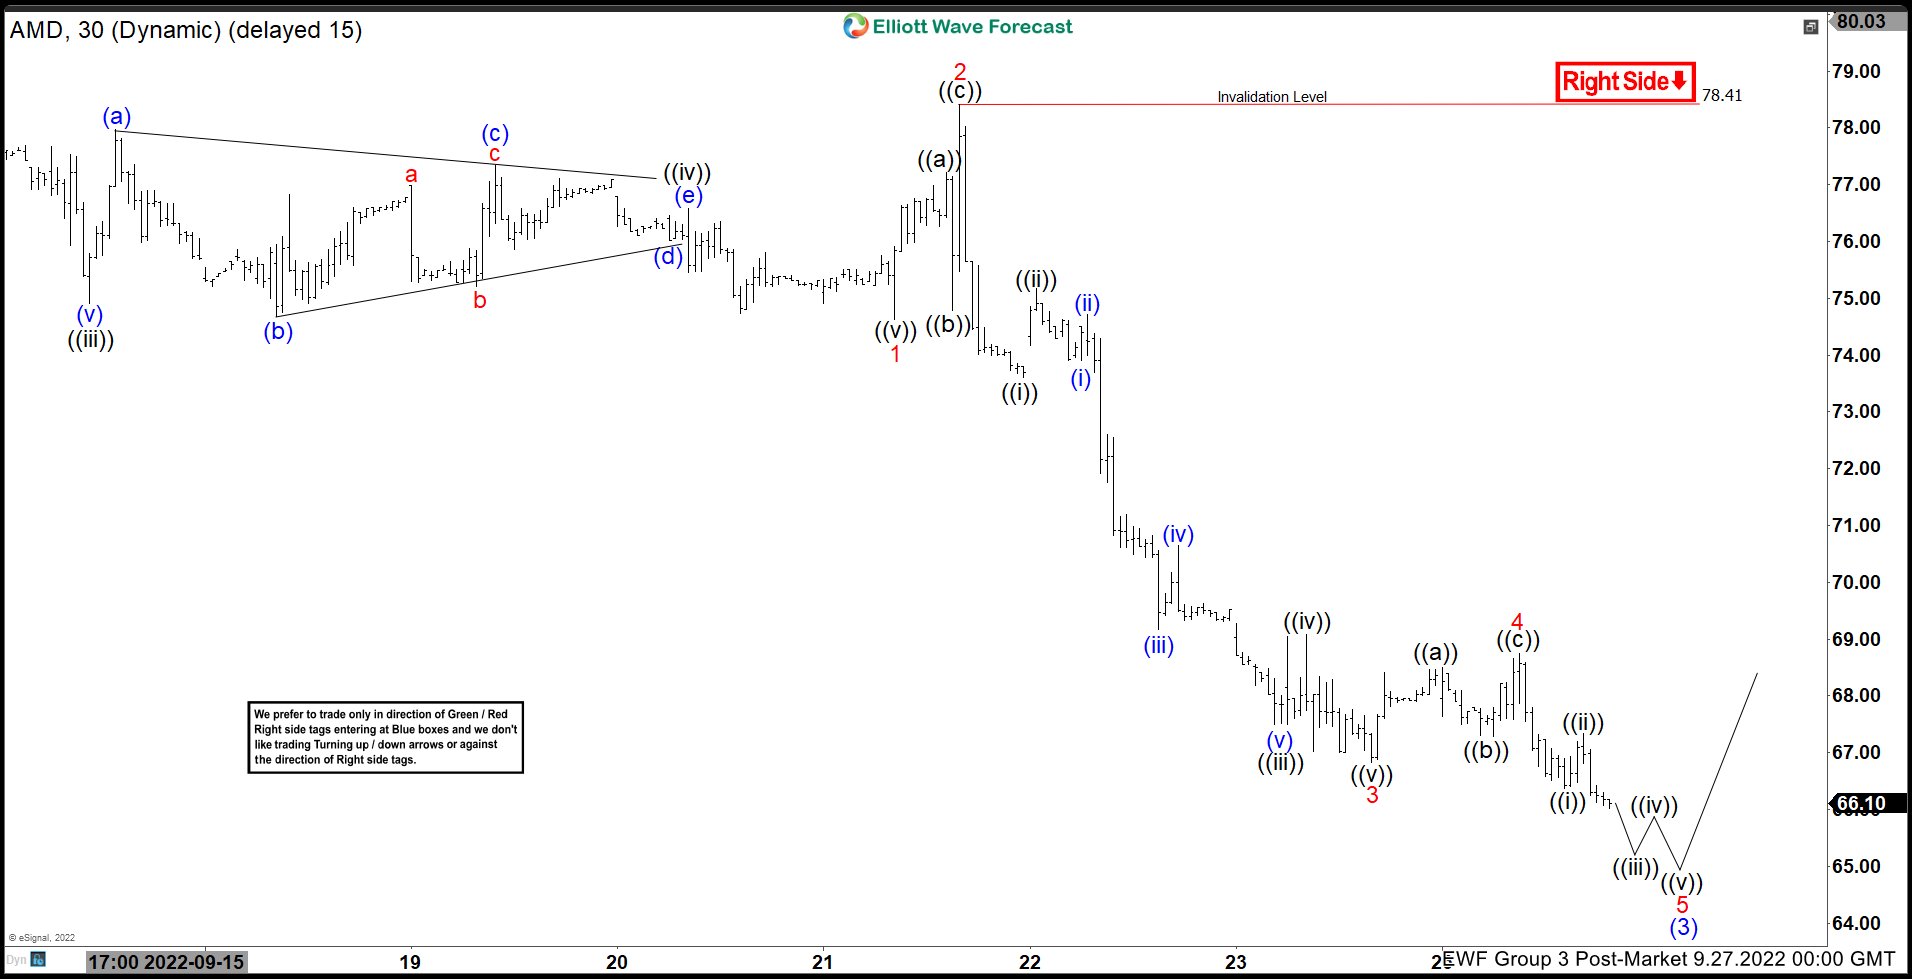
Down from wave (2), wave 1 ended at 74.63 and rally in wave 2 ended at 78.41. Down from wave 2, wave ((i)) ended at 73.60 and wave ((ii)) ended at 75.18. Wave ((iii)) decline ended at 67.50 and wave ((iv)) ended at 69.08. Final leg lower wave ((v)) ended at 66.82 which completed wave 3.
Corrective rally in wave 4 ended at 68.74 with internal subdivision as a zigzag. Up from wave 3, wave ((a)) ended at 68.50, wave ((b)) ended at 67.30, and wave ((c)) ended at 68.74. The stock has resumed lower in wave 5 and should see a bit more downside before ending wave 5 of (3).
As far as pivot at 78.36 high stays intact, expect rally to fail in 3, 7, or 11 swing for further downside.
AMD 30 Minutes Elliott Wave Chart